
Calculation of trunnion resonance frequency
and the first resonance frequency of the system
The resonance frequencies are calculated based on acceleration or displacement FR, measured at a constant value of the excitation parameter. The maintained excitation parameter value should not lead to exceeding of the maximum acceptable values; in the case of electromechanical vibration exciters, the displacement value should be as small as possible.
The trunnion resonance frequency corresponds to the first acceleration peak that exceeds the acceleration level at the frequency of 400 Hz more than in 1,5 times for electrodynamic shakers; around the frequency fn for electromechanical shakers and at the frequency (fn * fv)1/2 for other types of the vibration exciters.
The programs “Frequency response measurement at linear sweep by frequency” and “Frequency response measurement at logarithmic sweep by frequency” (the programs are available in SCADA ZETVIEW). Figure 1 shows the interface of the program with the FR of the calibrated shaker.
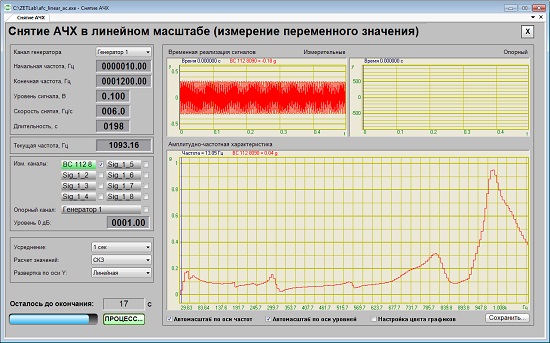
Figure 1
In order to obtain the FR of a vibration exciter, it is necessary to set the frequency range, output generator signal level to be sent to the shaker and signal type: linear frequency-modulated with linear or logarithmic sweep by frequency. The program allows to measure the FR by 8 control points simultaneously. The FR can be displayed both in linear and logarithmic scale.
In our case, we used linear FM signal with sweep by frequency in the range from 20 Hz up to 2,5 kHz. Graphical component Grid from the FR control program allows to record the FR measurements to a file with DTU extension. The file can be opened with Results view program (figure 2).
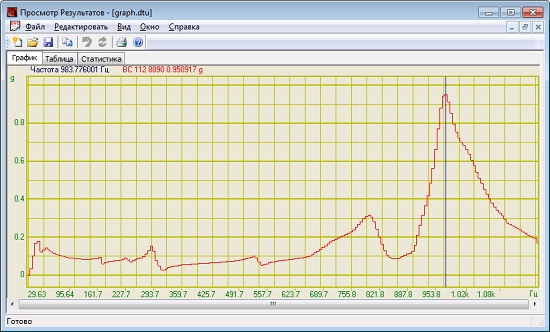
Figure 2
There is another method for evaluation of resonance frequencies of shakers and various structures, fixtures used for mounting of the tested specimen on the vibration exciter, etc. This method is based on the use of modal analysis for evaluation of dynamic characteristics of the structures using measurement results and analysis of the forced mechanical oscillations. To use this method, start the program Modal analysis included in the scope of ZETLAB software package.
For the purpose of modal analysis performance, it is necessary to use the impact hammer (see figure 3). The impact hammer is similar to ordinary hammer with the difference that there is a vibration transducer mounted to its head. The handle ends in a cable and a connector for the input channels of FFT spectrum analyzer.
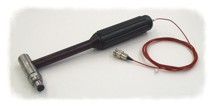
Figure 3
To produce a shock impact it is also possible to use the program “Shock impulse generator“, which allows to reproduce sine, triangular and rectangular shapes of signals with a pre-set duration and amplitude.
Figure 4 shows the main window of Modal analysis program after shock pulse impact produced by the program Shock impulse generator. The pulse curve is shown in the upper diagram. The below diagram shows the signal shape of the reference vibration transducer mounted on the shaker table. Synchronization and suspension of graphs in the time domain are conducted in automated mode. The activation threshold can be set at user’s discretion.
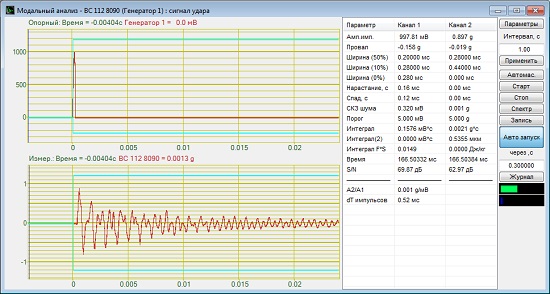
Figure 4
Upon activation of the “Spectrum” button in Modal analysis program there appears an additional window (figure 5), showing the graphs of narrow-band spectrum of the shock pulse (see the upper graph) and the signal of the reference transducer (the bottom graph). The right part of Spectrum program window shows the calculated values of the Q-factor, i.e. the damping ratio. The higher is the damping ratio, the higher will be the residual effect of the shock impact at the control point. This value is useful for engineering departments in the course of design (and modification) works since it allows to introduce changes in design for the purpose of decreasing high- or low-frequency resonance by shifting it outside of the working range.
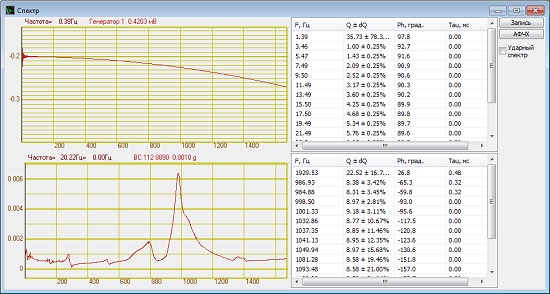
Figure 5
Based on visual and numerical data, one can see that the “images” in Figure 1 and the bottom graph in Figure 5 are identical, i.e. the resonance frequency values obtained by means of two different methods (FR control and Modal analysis programs) coincide with each other. This clearly shows that these two methods are applicable for the research of shakers (vibration exciters) frequency characteristics.
As one can see from Figures 2 and 5, the graphs of various methods used for resonance frequencies control coincide with each other. The use of an impact hammer enables resonance characteristics evaluation of shakers and any other structures. A single strike of an impact hammer provides you with a comprehensive notion of the frequency range and the resonance frequency of the controlled structure.
See also:
- Shaker calibration system
- Test-run of the shaker system
- Evaluation of vibration acceleration and frequency non-uniformity
- Evaluation of vibration acceleration, vibration displacement, and frequency range
- Evaluation of acceleration and/ or displacement harmonics ratio
- Calculation of lateral components ratio
- Calculation of distribution non-uniformity ratio
- Evaluation of the shaker table vibration noise level
- Evaluation of the tolerance limit for maintenance of the acceleration and/ or displacement level at the control point
- Evaluation of the tolerance limits for reproduction of acceleration and displacement level at the control point