
Calculation of distribution non-uniformity ratio
It is possible to conduct this stage of calibration in automated mode.
Start the SCADA-project “Clause 4.9 “Evaluation of acceleration, displacement and frequency range”. The program interface is shown in the figures below.


Prior to the beginning of measurements, it is necessary to set the shaker nominal characteristics and to start the calibration process:
- set the measuring channels of the transducers mounted on the shaker table as the reference channels;
- set the top and bottom frequencies in accordance with the shaker technical specifications;
- set nominal displacement and acceleration values as per technical specifications of the shaker system;
- start measurement process by clicking the “Calibration” key;
- upon completion of measurements, fill the section “protocol number” and save the protocol by clicking the “Save report” key.
In the case, if the user does not have the software “Shaker calibration”, it is still possible to perform corresponding measurements using ZETLAB software package.
Calculation of distribution non-uniformity ratio is performed in the nominal frequency range at constant acceleration value and (or) at the displacement at the control point not less than 30% of the nominal acceleration range upper limit and (or) displacement based on measurements data and (or) displacement using the program “AC voltmeter”.
It is necessary to mount several accelerometers (figure 1) on the top plate of the shaker (vibration exciter). Then the values of acceleration and (or) displacement for each vibration transducers are calculated by means of “AC voltmeter” program.
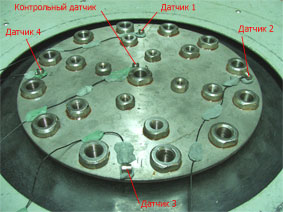
Figure 1
The main program interface based on the interface of FFT Spectrum analyzer is shown in Figure 2. The left part of the display contains programs “Generator of different waveforms”, “Formula”, “AC voltmeter” and “DC voltmeter”. The right part of the display contains “Multichannel oscilloscope” program window. In this case, the transducer “BC 112 8099” is used as a reference transducer and it is placed in the center of the shaker table, while the remaining transducers are used for measurement purpose and are placed at the edge of the of the shaker table. The program “AC voltmeter” is used for display of transducers measurement data.
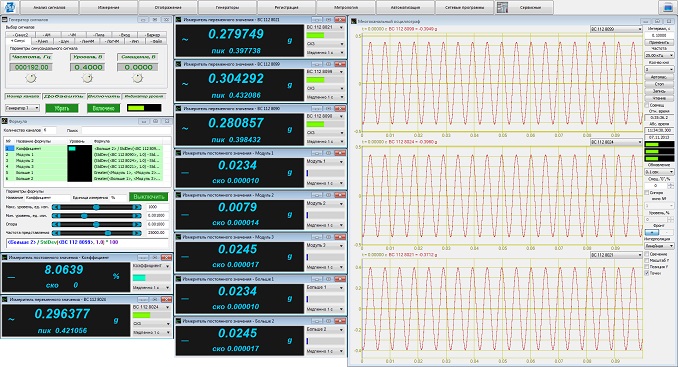
Figure 2. Operator’s desktop: FFT spectrum analyzer interface
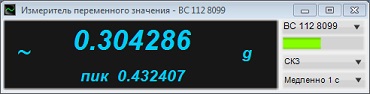
Figure 3. Measurement data of the reference transducer BC 112 8099

Figure 4. Measurement data of the transducer BC 112 8099
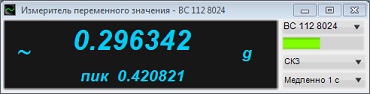
Figure 5. Measurement data of the transducer BC 112 8024
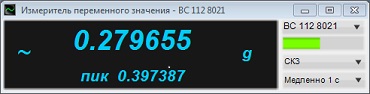
Figure 6. Measurement data of the transducer BC 112 8021
Distribution non-uniformity ratio in this particular mode of shaker operation is calculated in percentage by the formula:
![]()
where ai — acceleration or displacement in the mounting point i; ar —acceleration or displacement value at the reference point.
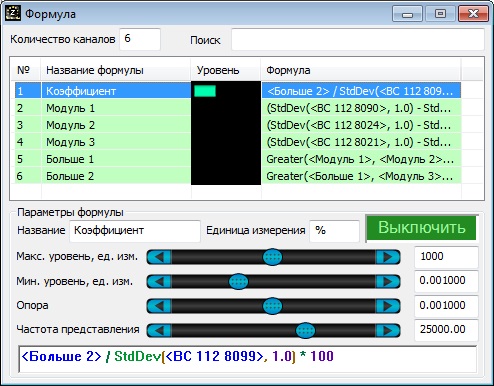
Figure 7. “Formula” program used for automated calculation of distribution non-uniformity ratio
In order to automatically calculate the distribution non-uniformity ratio for four transducers, it is necessary to start the “Formula” program and to set 6 formulas:
1.Formula name: «Module 1»; measurement units: «g»; formula: ” (StdDev(, 1.0) — StdDev(, 1.0))| «.
2.Formula name: „Module 2“; measurement units: „g“; formula: » (StdDev(, 1.0) — StdDev(, 1.0))| «.
3.Formula name: „Module 3“; measurement units: „g“; formula: » (StdDev(, 1.0) — StdDev(, 1.0))| «.
4.Formula name: „Greater than 1“; measurement units: „g“; formula: » Greater(, ) * ( — ) + «.
5.Formula name: „Greater than 2“; measurement units: „g“; formula: » Greater(, ) * ( — ) + «.
6.Formula name: „Ratio“; measurement units: „%“; formula: » / StdDev(, 1.0) * 100 «.
In the program “AC voltmeter” it is possible to view the readings of the channels from “Formula” program.
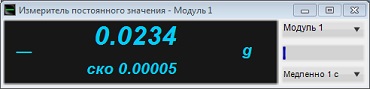
Figure 8. Measurement values of the formula “Module 1«
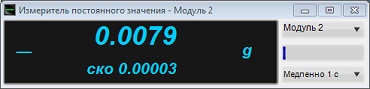
Figure 9. Measurement values of the formula «Module 2»
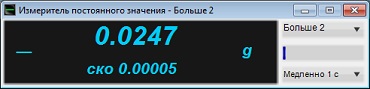
Figure 10. Measurement values of the formula «Module 3»
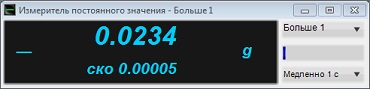
Figure 11. Measurement values of the formula «Greater than 1»

Figure 12. Measurement values of the formula «Greater than 2»
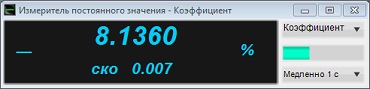
Figure 13. Measurement values of the formula «Ratio»
The program “Multichannel recorder” allows to track the changes in acceleration values at various points of the shaker table for a long time period (figure 14).
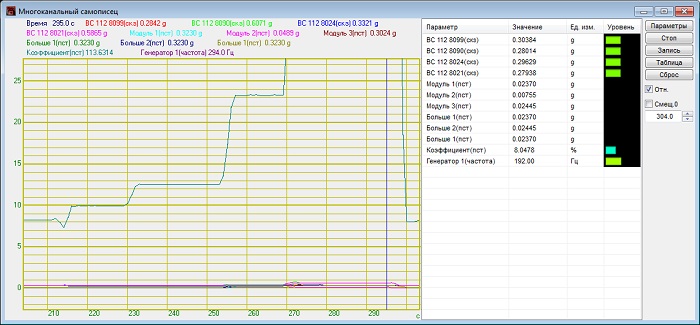
Figure 14. “Multichannel recorder” program acceleration dynamics control.
See also:
- Shaker calibration system
- Test-run of the shaker system
- Evaluation of vibration acceleration and frequency non-uniformity
- Evaluation of vibration acceleration, vibration displacement, and frequency range
- Evaluation of acceleration and/ or displacement harmonics ratio
- Calculation of lateral components ratio
- Calculation of trunnion resonance frequency and the first resonance frequency of the system
- Evaluation of the shaker table vibration noise level
- Evaluation of the tolerance limit for maintenance of the acceleration and/ or displacement level at the control point
- Evaluation of the tolerance limits for reproduction of acceleration and displacement level at the control point