Signal post-processing
Experimental Data In-Depth Analysis
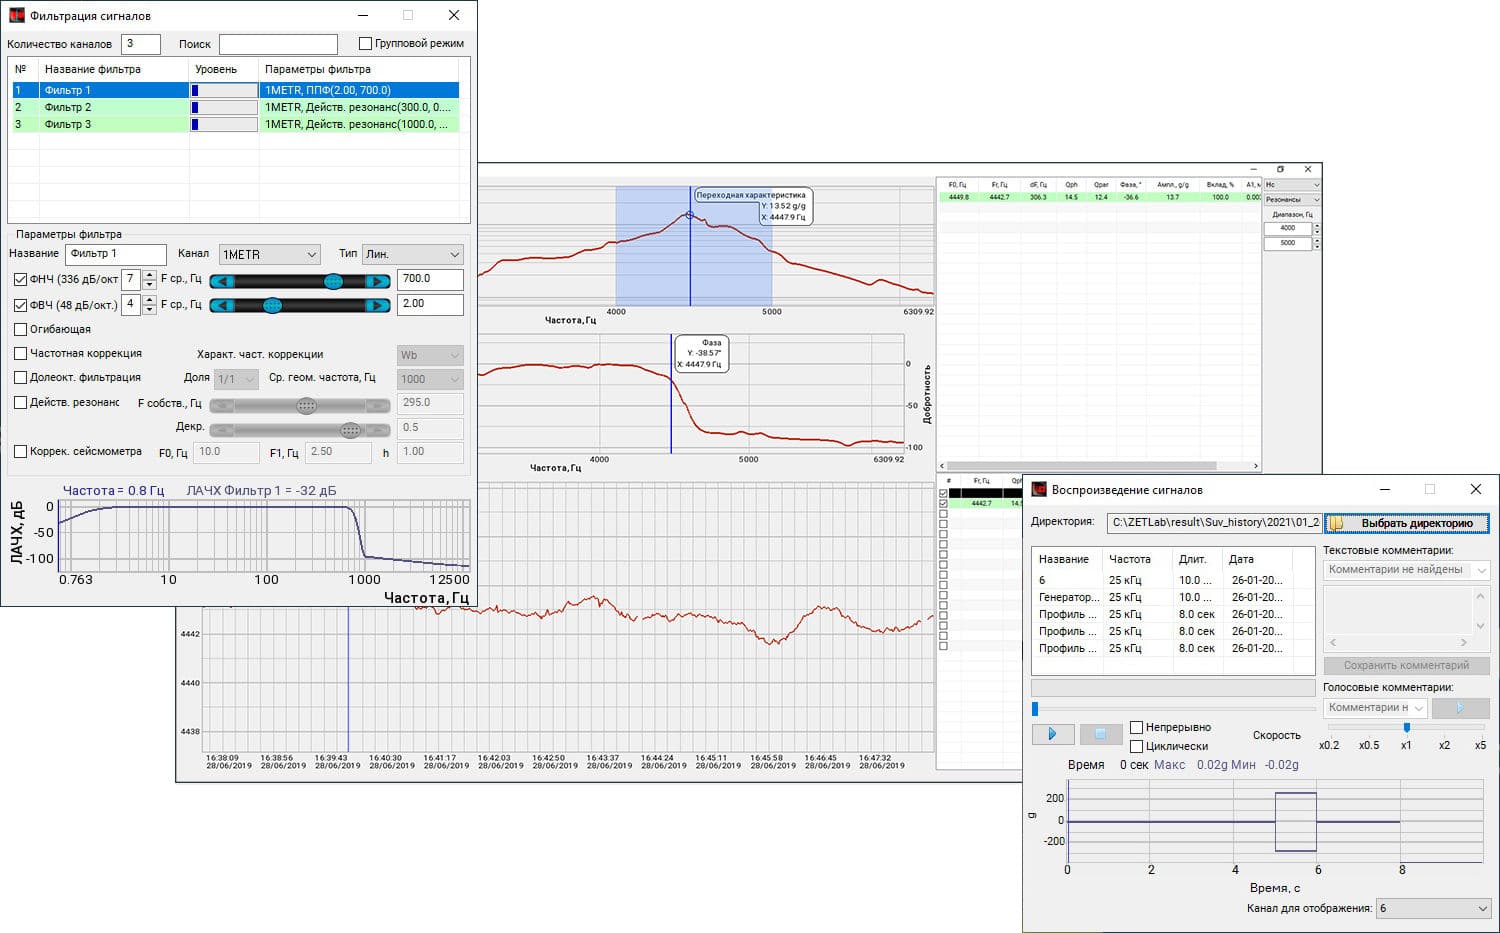
It is not always possible to perform in-depth analysis of the instant signals while testing items for resistance to external mechanical impacts. This may be due to both complex processing algorithms and speed of testing itself.
Signal recording and post-processing in less stringent conditions makes it possible to study in detail the item behavior and identify its defects including minor ones which occurred during testing.
The signal post-processing programs included in the ZETLAB VIBRO software package operate in the following main modes:
- signal playback – using the signal reproduction program,
- signal band filtering – using the signal filtration program,
- spectrum analysis – using the FFT Analysis (narrowband spectrum) program,
- cross narrow-band spectrum analysis – using the Cross-Spectrum FFT analysis program.
SIGNAL filtration
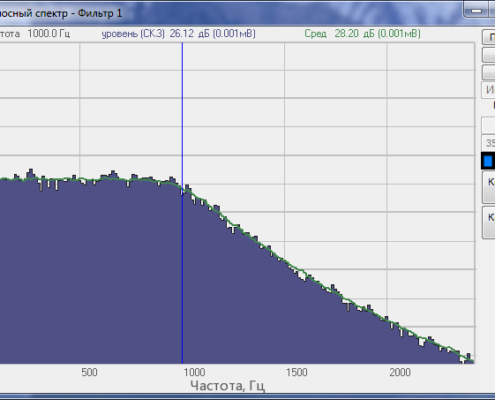
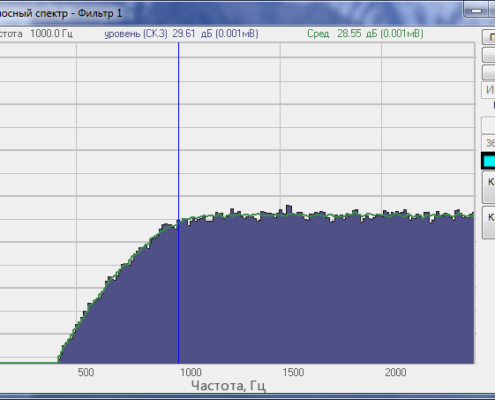
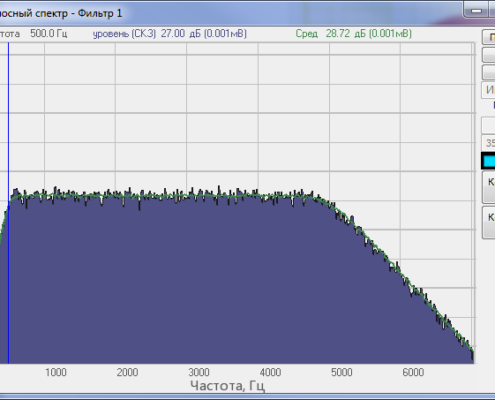
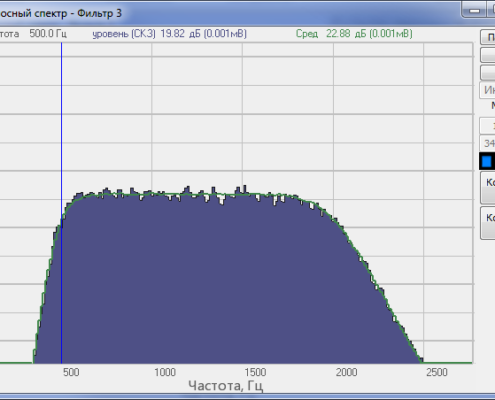
Using the Signal Filtering program, you can perform band filtering used for preliminary signal analysis and meaningful frequency band extraction.
SPECTRUM ANALYSIS
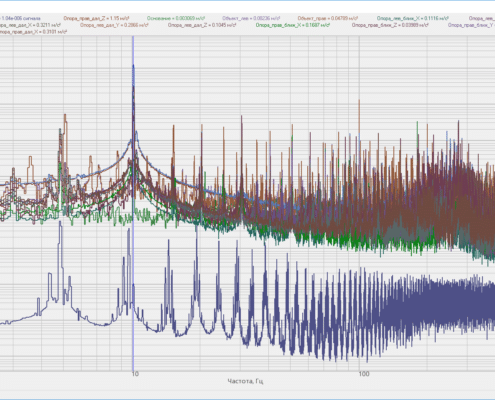
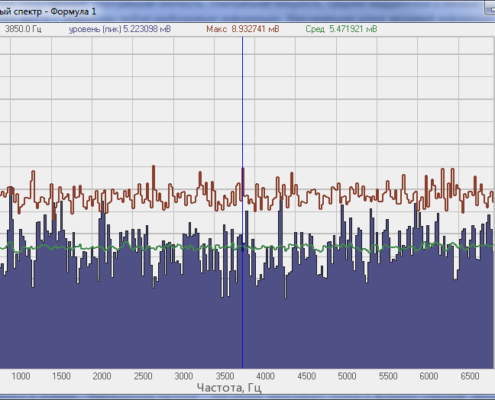
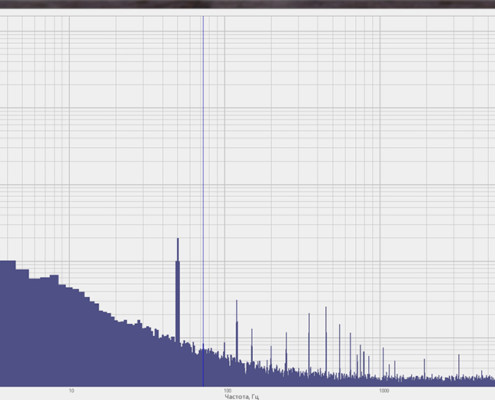
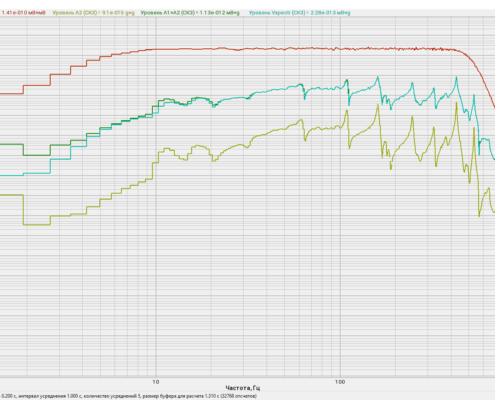
Spectrum analysis is used for studying the frequency content of a measured signal. This can be explained by its physical demonstrativeness, and by the possibility of meaningful interpretation of the results obtained. Using the FFT Analysis program, the user, the user can detect the tone signals (discrete components) and noise components in the measuring channel by viewing the spectrum shape.
Using the spectrum analysis for recorded signal post-processing, you can easily:
- perform vibration narrow-band spectrum analysis in extended frequency ranges,
- obtain main spectrum characteristics of signal,
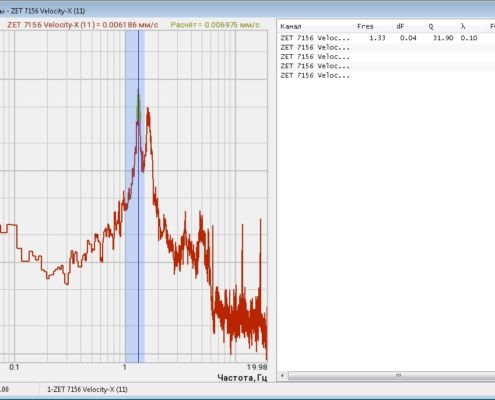
- determine natural frequencies of a studied item.
CROSS-SPECTRUM FFT ANALYSIS
In some vibration diagnostic studies, another type of analysis is also used: bi-directional spectrum analysis of two signals measured in different reference points and/or in different directions.
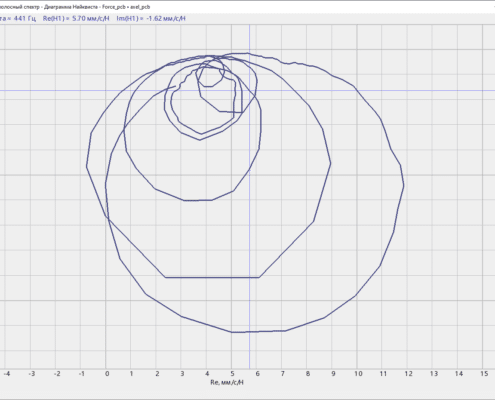
In the Cross-Spectrum FFT Analysis program, you can calculate power cross-spectra, phase spectra, coherence spectra, and impulse characteristics.
Most frequently used methods of identifying frequency characteristics in the bi-directional spectrum analysis are:
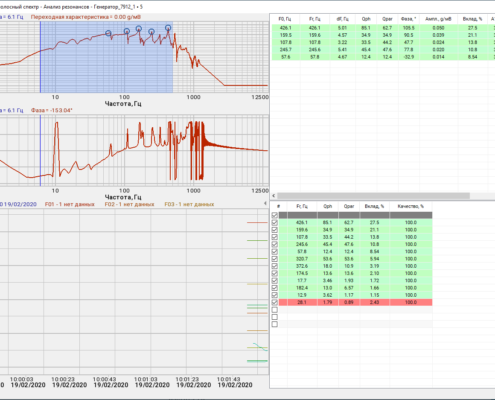
- analysis of resonances and their contribution amplitude,
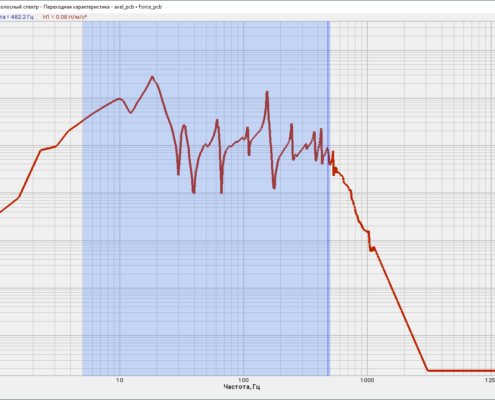
- transient response analysis,
- identifying natural frequencies.

