System for acoustic emission parameters control

The system for acoustic emission parameters measurement is represented by software and hardware complex used for detection of acoustic emission events and calculation of the corresponding parameters.

The system allows to:

  • Find location of acoustic emission signals source
  • Estimate time characteristics of acoustic emission signals parameters (i.e. to perform spectral analysis)
  • Evaluate deformation mechanisms (statistical distribution – histogram)

Controlled parameters

acoustic emission parameters

Amplitude of AE pulse
Build-up time of the pulse
Fall time of the pulse
Amount of threshold crossings
AE signals power
Precise time of AE event

Operating principles

acoustic emission parameters

High-frequency generator  ZET 7191 is used to imitate acoustic emission signals together with acoustic emission sensor ВС 601, which is used as an oscillator.

The remaining acoustic emission sensors ВС 601 are used for conversion of acoustic emission signal into electrical signal. Digital module ZET 7140-E performs amplification, filtration, ADC conversion of electrical signal received from ВС 601, as well as transfer of the digitized data via CAN interface.

Interface converter ZET 7176 (CAN↔Ethernet) is used for data transfer to PC.

Modules ZET 7176 enable the creation of distributed multichannel data acquisition systems with channels synchronization by PTP protocol (IEEE 1588).

Структурная схема стенда измерения параметров АЭ

Detection of AE events and calculation of the parameters is performed in accordance with the algorithm described below.

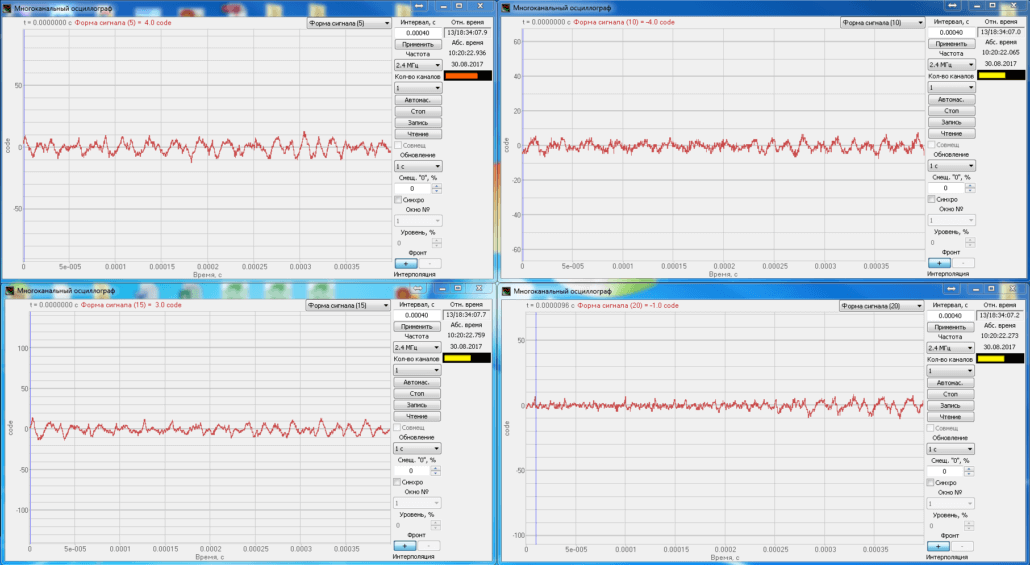
Measuring modules ZET 7140-E have three measuring channels with the following functions by default:

  • Signal shape
  • Noise level
  • Parametrical channel

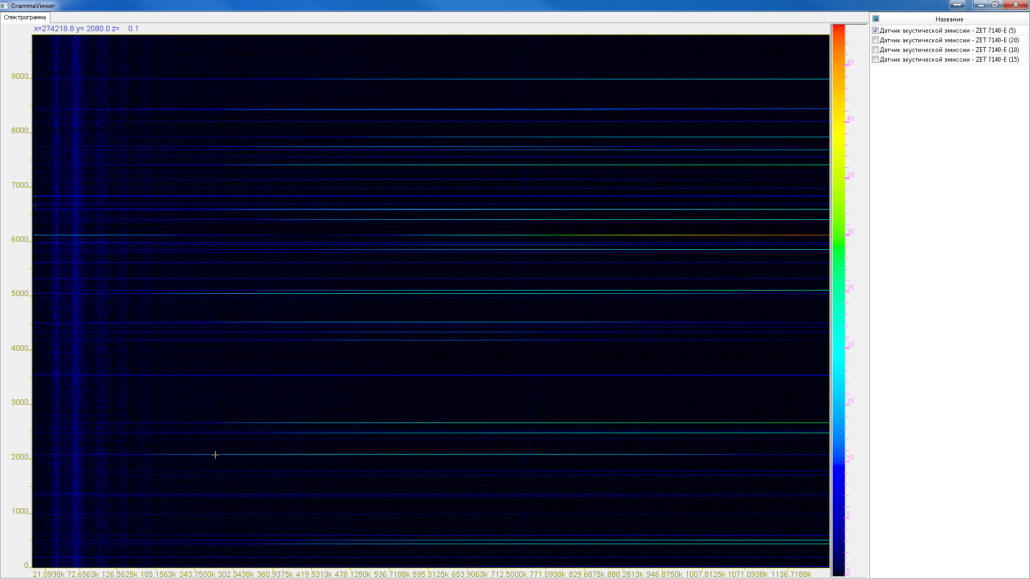
AE events signals have a high-frequency range (signal selection frequency: 2,4 MHz). This is exactly why it is necessary to transfer data for processing in separate sections – the so-called “windows”.

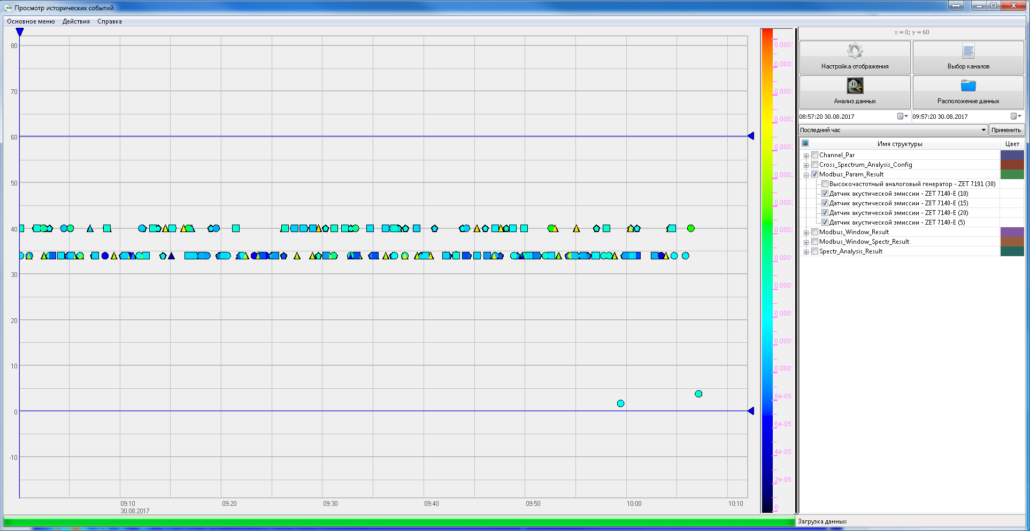
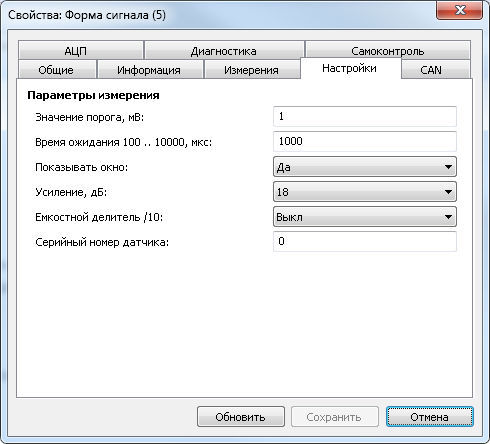
In the settings of digital modules ZET 7140-E it is possible to set the threshold value, which will be used for events detection (the threshold value can be set in the range from 0,5 up to 100 mV). The threshold level value should be a little more than that of the digital sensor natural oscillations.

Настройки цифровых датчиков

In the case if there has not been any threshold crossing, module ZET 7140-E will not send the data to PC and will continue processing of the data received from the acoustic emission transducers. In the case of the threshold level crossing, module ZET 7140-E will evaluate AE pulse amplitude, build-up time, fall time, amount of the threshold level crossings and AE pulse power. This data will be sent to the PC via the parametric channel, the corresponding events will be recorded to the logger for further viewing and processing.

Visual representation of the accumulated data is performed by means of programs included into the scope of ZETLAB software package:

View historical events

The data from digital sensors, which has been saved to the logger, is available for further analysis in View historical events program.

The data is represented as a graphical information in time coordinates.
Просмотр исторических данных

Depending on the particular data you need, there are several ways of displaying the graphical information:

  • dependence of amplitude on time with the indication of signal power
  • dependence of build-up time on time with amplitude indication
  • dependence of the number of threshold crossings on time with the indication of signal power, etc.

In the case if it is necessary to depict a chart for each section, check the box “Separate chart for each field”.  Upon completion of data display configuration, a more detailed information of the selected data structure will be available.

Настраиваемые параметры отображения (временные хар-ки)

Super-resolution spectrum

The program allows obtaining the spectrum chart of signal window.

The program creates 2-dimensional sonogram of the selected signal. The horizontal axis depicts frequency values in the selected window, the vertical axis stands for time parameters. The color indication depends on a particular spectral density value.

The color indication of the sonogram enables easy evaluation of the maximum value changes, which, depending on the particular task, can be represented by resonance, natural frequency or any other parameter of the controlled narrow-band signal.

Спектрограмма

Multichannel oscilloscope

The operator can configure display parameters for each of the measuring channels by means of Multichannel oscilloscope program

Сигналы по каждому каналу

Advantages of the system

acoustic emission parameters

Automation

calculation of the parameters in accordance with the set algorithm

Operational efficiency

instant processing and display of the measurements data

Compact dimensions

small area of the workplace

Reliability

stable characteristics throughout operational lifetime

Order form - If you want to place an order or to make a request regarding technical specifications of particular product, fill out the form below: