Cross-Spectrum FFT Analysis
The program Cross narrow-band spectrum is used for evaluation of the interrelation between the signals’ parameters obtained from the two primary transducers installed at various parts of the controlled object. This program can be used for detection of noise source location, for sound absorption level evaluation and the researched object acoustic properties control, for evaluation of space-time distribution of the directional energy flux (Poynting vector), for the ground cross-section FR characteristic evaluation (Nakamura method), etc.
The program Cross narrow-band spectrum is used for calculation of power cross-spectrum, phase spectra, coherence spectra, pulse-response characteristics, as well as for resonance calculation.
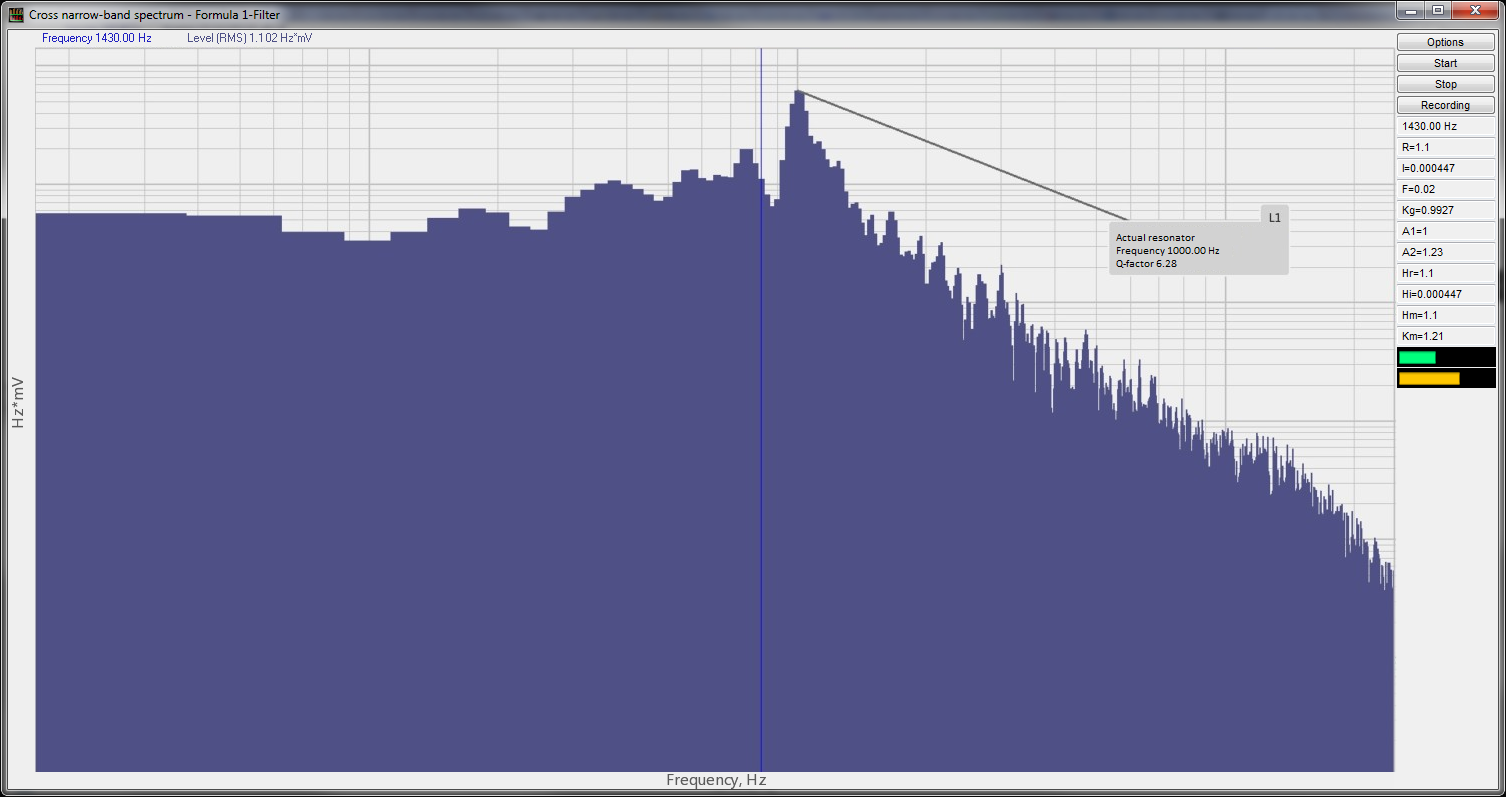
Cross narrow-band spectrum program enables graphical representation of various spectral characteristics of the signals, thus, allowing to reveal the enhanced vibration amplitudes at resonance frequencies of the researched object or the components of a complex system. These functions allow to timely reveal the defects and to undertake corresponding preventive measures.
Implementation of the cross narrow-band spectrum analysis of the signals received from the input channels of the FFT Spectrum analyzers is possible both in the real-time mode and the accumulated data post-processing mode.
Cross narrow-band spectrum belongs to the group of classical signal analysis methods and is widely applicable for almost all classes of signals having stationary properties.
Main functions of the program
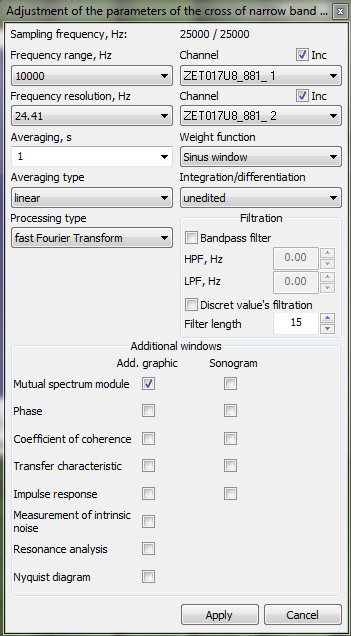
- measurement and representation of the signal in narrow spectral bands. The number of bands can be equal to the power of two (128, 256, 512, …, 262144) or to an arbitrary number (e.g., 100, 200, 500, …, 250000) with the use of Z-conversion;
- measurement and representation of signal spectral characteristics with various averaging types (linear, exponential), processing (integration, differentiation) and representation (RMS or peak value);
- measurement and representation of real and imaginary part of the signal, phase difference and signals coherence coefficient;
- measurement and displaying of the instant spectrum modulus;
- measurement of the complex frequency response and coherent power of the spectral component;
- measurement and graphical representation of signals transient characteristics.
The program allows to activate additional dialog windows with graphical representation of the following parameters:
In spite of the fact that accurate evaluation of the frequency response characteristic implies adherence to the system linearity requirements (while the linearity is a rare system property in real conditions), the cross narrow-band spectrum analysis allows to obtain comprehensive results, that describe the best possible (RMS) linear approximations of the researched systems. This is especially important when it comes to extremum values statistics research for the prevention of buildings and structures destruction caused by accidental impact. [J. Bendat, A. Piersol: “Engineering Applications of Correlation and Spectral Analysis”, 1983].
Cross-spectral densities are represented as functions with frequency dependence. This fact allows to use the spectral analysis in the engineering tasks domain (where previously the correlational methods used to be widely spread).
An important advantage of the cross narrow-band spectrum (if compared to the correlation analysis) is that it is unnecessary to have a dispersion-free environment.
Cross narrow-band spectrum analysis is also used for localization of the signal source.
The spectral density parameter is a convenient tool for direct evaluation of physical systems properties based on input and output parameters of the system (the same principle is applicable to multi-dimensional systems).


