
Nyquist diagram is one of the additional functions of the program Cross narrowband spectrum. It allows to evaluate the stability of the system based on amplitude-frequency response characteristic of system’s open circuit. By system stability, in this case, we mean the property of the system to restore the equilibrium state, which has been distorted due to the impact of external factors.
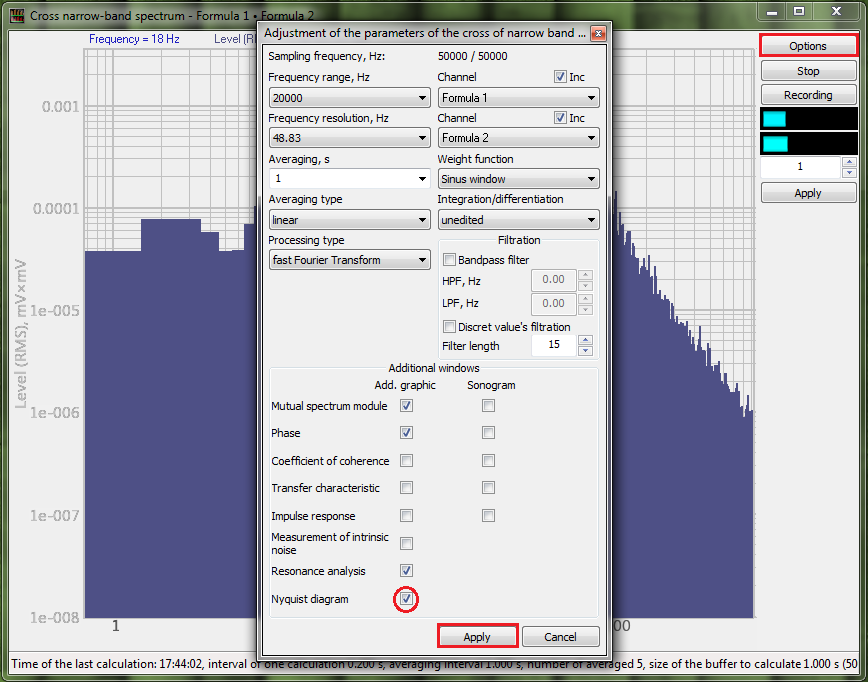
To activate the dialog window of the Nyquist diagram option, enter the parameters configuration window of the program “Cross narrowband spectrum” by clicking the “Options” key. Select the option “Nyquist diagram” in the “Additional graphics” menu of “Additional windows” section.
AFR characteristic is a convenient representation of frequency response of a linear stationary dynamic system. AFR characteristic is displayed as a graph in complex coordinates. This graph combines AF and phase-frequency characteristic within one plane.
The option “Nyquist diagram” allows to display AFR characteristic in various coordinate systems.


The most popular use of the option “Nyquist diagram” is evaluation ща closed-loop system stability.
An advantage of this type of analysis is that the digram can be created based on the measurement data accumulated in a particular mode. It is the only applicable method in the cases when the transient function of open-loop circuit system is not clearly defined or is determined by an asymptotic curve.