
Trend Viewer
A trend is a diagram facilitating analysis of long records of measured sensor values (for hours, days, months, years). Based on the sampling frequency, an n number of counts per second are performed, and their yearly number equals to 31,556,926*n. If the user needs to evaluate short-term moments of the source signal, then there is no difficulty. It is much more difficult, when it is necessary to evaluate the parameters for the entire year or several years, and no monitor and no person would handle it. And this is the case when trend building could help.
A trend is a certain compressed envelope curve of the source signal based on the measured data, with several compression degrees. One trend point includes the minimum and maximum values of counts per second. The main objective of an envelope curve is to look through the changes in the recorded parameters for a long period, evaluate the signal dynamics, while providing the possibility to zoom in the diagram to a specific date, a specific minute.
As for ZETLAB software, trend recording is included in Signal Recording and Multichannel Recorder. Both programs record the source signal with sampling frequency and make extracts indicating the compression degree, but, besides that, the multichannel recorder allows for viewing any changes in the signal RMS, frequency, etc.
Several degrees of compression are used for trend building: 1 second, 10 seconds, 1 minute, 10 minutes, etc. Based on the duration of the extract, different degrees of compression are possible, e.g. when viewing a trend for a year or more it would be a 10-minute compaction, while for viewing a trend for a day it could even be just 1 second. It is possible to reset zeros, which allows to measure relative values.
The recorded data is structured in folders: years, months, days, hours. The specific feature of hourly records is their reference to the PC time, i.e. at any moment from the start of recording hourly recording, in which the first minutes will be absent (there are no first minutes), is performed anyway, and then signal recording starts. The averaged, i.e. compressed signals are recorded to another directory; there are only Year and Month folders. Such values are recorded for the entire month; different files have different compression degrees: 1 s, 10 s, 1 min, 10 min, 4 hours, etc.
Trend reading and display are supported in different applications, since data is often located on the servers, and signals are viewed at automated workplaces (AWP). The application which scans records, forms and sends them, is started on the server. AWPs receive the formed data and display the trend.
To connect with the server, it is necessary to enter the server IP address in the trend display application; if the server and AWP are located on the same computer, it is necessary to enter the local host: 127.0.0.1. After connection is established, the trend is automatically loaded on the screen, displaying the data for the entire period during which data from the sensors was collected (Fig. 1).
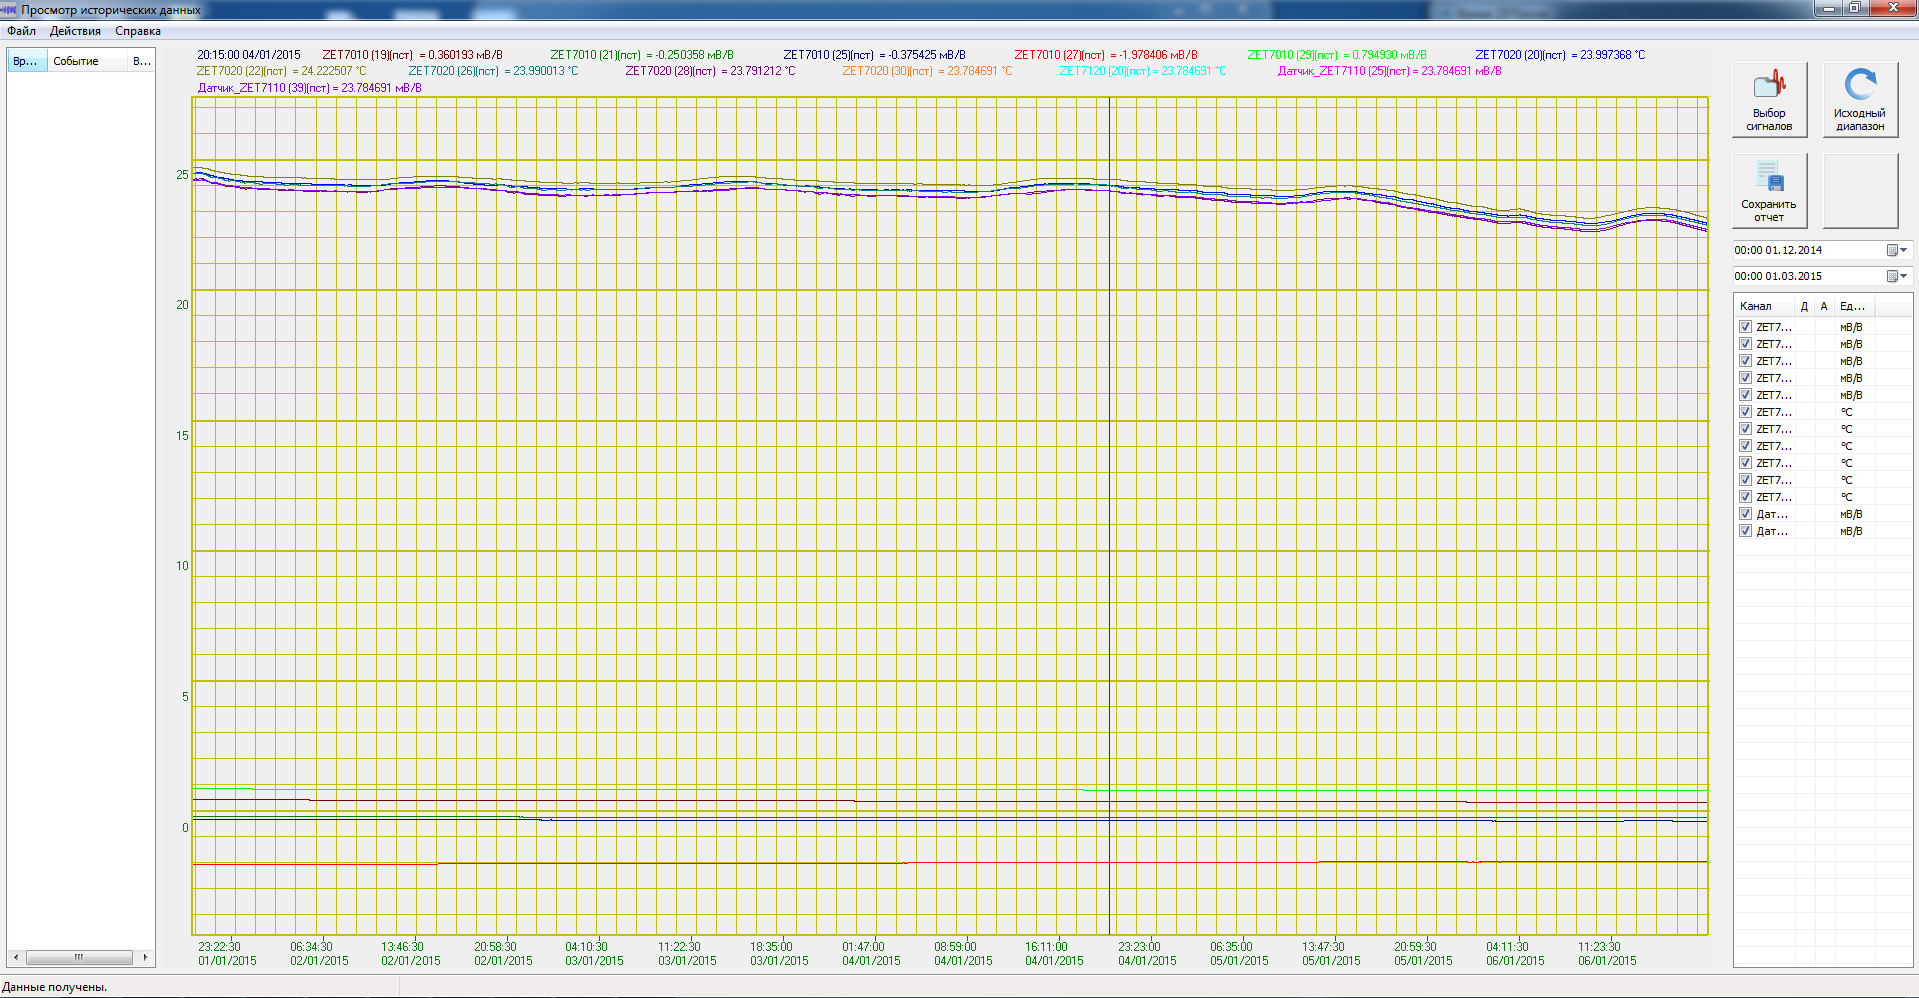
Fig. 1 Long-period trend
For a more detailed trend display (Fig. 2), it is possible to select a period and specific signals based on their names and units of measurement. When viewing a trend, it is possible to zoom the diagram in or out with the left mouse button, and the program calculates the amount of data to be requested for building a detailed view, the compression degree, etc.
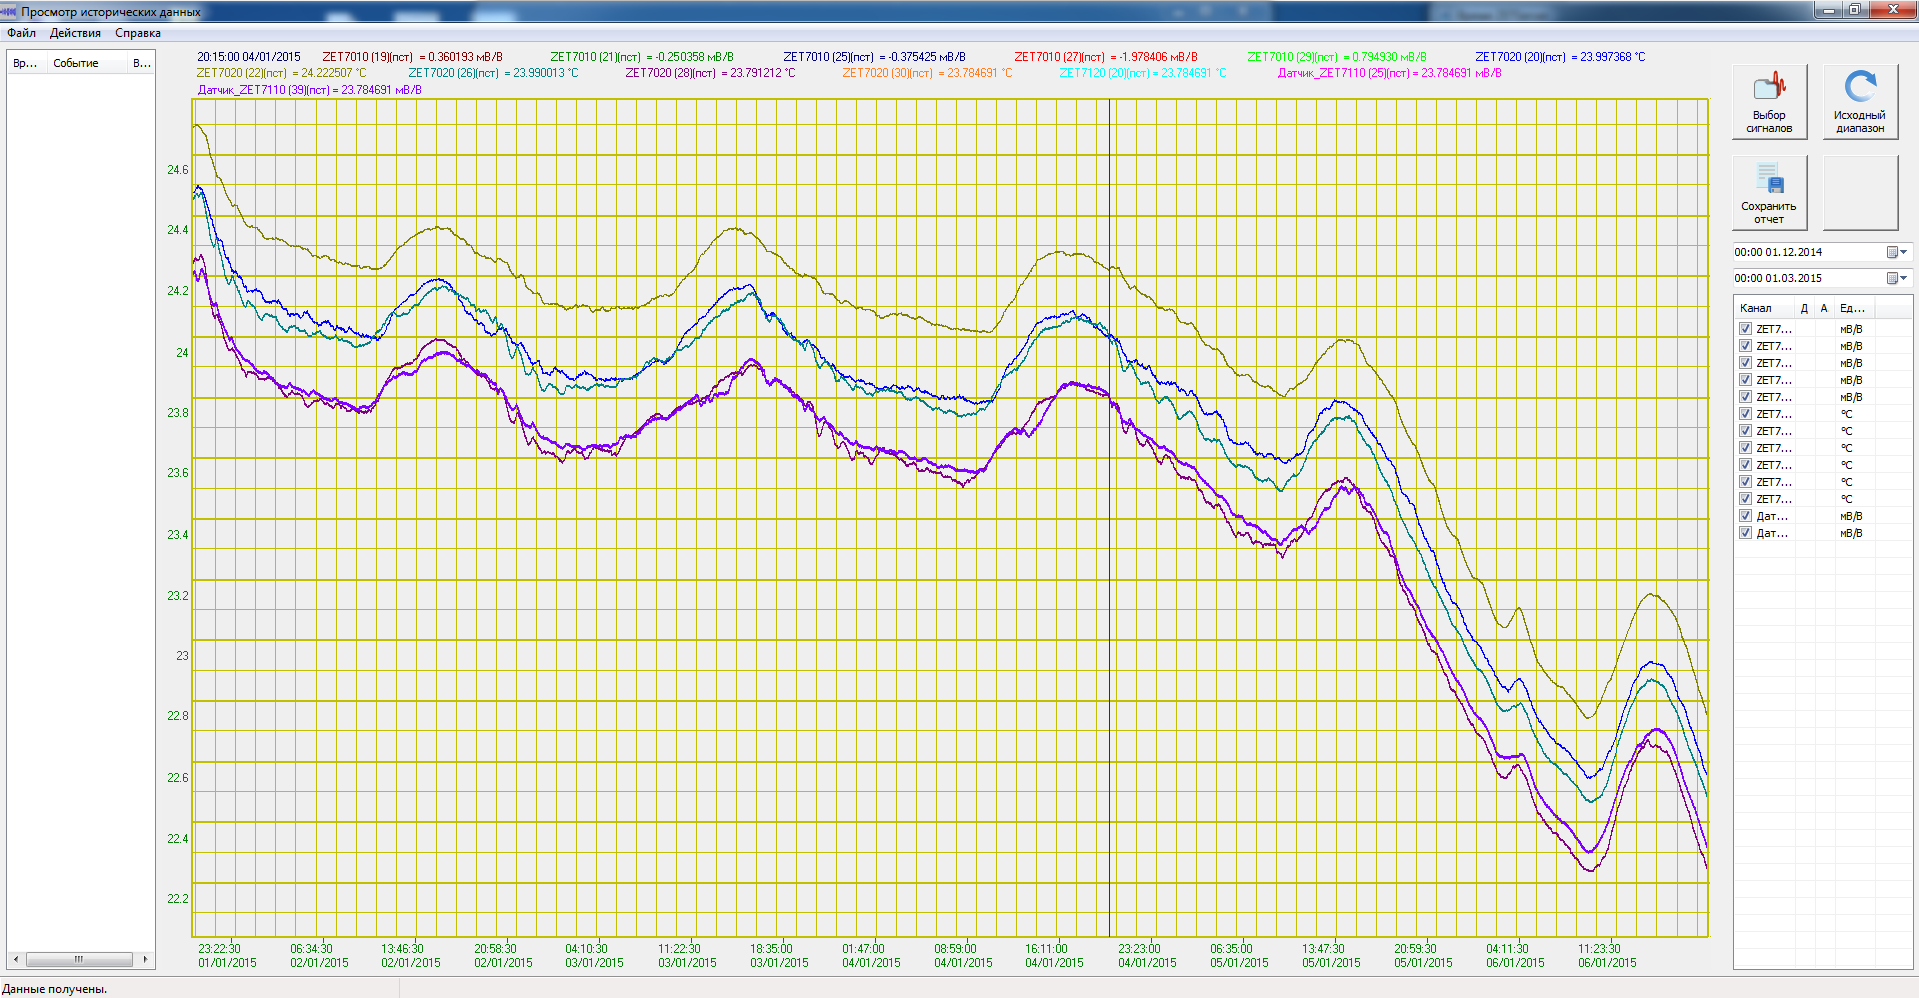
Fig. 2 Detailed trend display
The program allows for grading the absolute and relative values, returning to the source range (i.e. to the initial view), saving the report in .csv format, printing it, using the event data base, viewing the historical data.
The trend allows for viewing not only a short-term recording of values, but also a long-term one, while displaying the measurement results for the selected parameter. The compression degree allows for viewing the data recorded during a long period, viewing the approximate shape/envelope curve of the channel. The program has a user-friendly interface facilitating total navigation across the channel.
Using the trend helps in many applications, such as temperature measurement, crack opening control, etc. It is easier to check a crack in the structure for compression and expansion based on the temperature using strain-gauge sensors, since it takes quite a long time to measure the parameters, and viewing the trend makes it much easier to interpret the measurement results.
Users of the previous versions of ZETLAB software, which do not have trend recording and display, can enjoy the possibility to convert the signals recorded earlier and then view them on trends.
Trend Viewer is a part of the following software:
- ZETLAB BASE – ADC/DAC module software;
- ZETLAB ANALIZ – FFT Spectrum Analyzers software;
- ZETLAB VIBRO – shaker control systems software;
- ZETLAB TENZO – strain-gauge station software;
- ZETLAB SEISMO – seismic station software;
- ZETLAB NOISE – vibration meter-noise meter software;
- ZETLAB SENSOR – digital ZETSENSOR sensor software.
Trend Viewer is included in the Recording software group.