
Research of coolant fluid temperature sensor dynamic characteristics
Laboratory research # 2
Laboratory research plan:
1. Overview of sensor structure and operating principles.
2. Connection scheme of the sensor to electrical circuit — transistor power supply module.
3. Operating principle of measuring complex based on ADC module ZET 210 and user interface.
4. Connection of the sensor to measuring system.
5. Research of sensor’s dynamic characteristics during heating from ~20°С up to 100°С.
6. Processing of experiment results. Calculation of sensor transfer characteristics. Calculation of transfer ratio and constant component of the sensor.
7. Modeling of transient process which takes place during heating of the sensor in MATLAB Simulink. Recalculation of transfer ratio parameters.
8. Report on laboratory research. The report should contain:
— connection scheme of the sensor to ADC;
— transient process chart;
— transfer characteristics of the sensor, transient process graphs overlay.
Structure and operating principles of liquid coolant temperature sensor
Liquid coolant temperature sensors 23.3828 and 27.3828 (figure 1 and 2) are used for temperature control of liquid coolant at the outlet connection of cylinder head within the scope of electronic engine control system. The sensors are used in the engines equipped with electronic engine control systems (figure 3).
Figure 1 — Overview of temperature sensor 23.3828
Figure 2 — Overview of temperature sensor 7.3828
Figure 3 — Temperature sensor 27.3828 installed in the engine
Basic technical characteristics of temperature sensors are shown in Tables 1 and 2.
Table 1
| Characteristics | Value |
| Operating voltage, V | 3,4±0,03 |
| Impedance, Ohm: | |
| at 15 °С | 4033…4838 |
| at 128 °С | 76,7…85,1 |
| Thread | М12×1,5 |
| Thread for the key | S19 |
| Weight, g | 30 |
Table 2
| Characteristics | Value |
| Nominal voltage, V | 12 |
| Measured temperatures range, °С | +(40…130) |
| Weight, g | 50 |
Operating principle of the sensors is based on the property of conductors and semiconductors to change their resistance depending on temperature fluctuations. The thermistor placed inside of the sensor has negative temperature resistance ratio, i.e. when it is heated, the resistance decreases. At high temperature of the liquid coolant the thermistor has low resistance and vice versa.
2. Sensors connection scheme
As the sensors of this type are connected to the measuring system, it is necessary to provide constant level current in the range 1,0…1,5 А. In this case during temperature fluctuations a sharp decrease of sensor voltage will be proportional to its resistance. In this laboratory research a transistor power supply module is used to power up the sensors (figure 4,5). Using variable resistor R1 and ampere-meter, sequentially connected to the temperature sensor R5, it is possible to set the necessary current level depending on power supply voltage. The power supply module is connected to 12 V source via 4-pin contact (white). 2-terminal connector (green) is used for sensor’s connection. This terminal connection is used to measure voltage decrease of the sensor to be further calculated into temperature value. This type of power supply is provided by electronic engine control system.
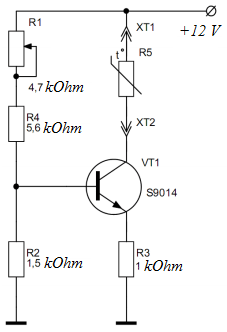
Figure 4 — Transistor power supply module – electrical diagram
Figure 5 — Transistor power supply module: overview
3. Measuring complex based on ADC converter ZET 210
The measuring complex used in this laboratory exploration consists of:
1. ADC module ZET 210 with the controlled sensor connected to it (figure 6);
2. Laptop connected to ADC via USB 2.0;
3. ZETLAB software, allowing to change ADC settings, primary processing of the signals, their representation and recording to a hard-drive.
ADC module ZET 210 is used for measurements of signal parameters from various primary transducers in wide frequency range (with sampling frequency up to 500 kHz). In addition to that the module has digital and analog outputs that can be used for the purpose of various actuating mechanisms control.
1 — terminals for connecting output analog signals; 2 — USB 2.0 for connection to PC; 3 — LED indicator of power supply Figure 6 — Overview of ADC module ZET 210
Basic technical characteristics of ADC module ZET 210 are available at our web-site. ZET 210 — portable measuring laboratory!
ADC module ZET210 is used together with the software from ZETLAB scope, which is installed on a laptop connected to USB 2.0 interface. Control and start of ZETLAB programs is available at ZETLAB panel. To start it, you can use the icon on the desktop or menu Start→ ZETLab → ZETPanel. ZETLab panel is a horizontal panel at the top part of the screen (see figure 7).
Figure 7 — ZETLAB control panel
In this research settings of ADC module ZET210 are changed by means of the following menu: ZETLAB Service → Devices manager. In the settings window it is necessary to set “4000 Hz” sampling frequency value (figure 8). In the measuring channel settings, set differential activation (figure 9).
Figure 8 — Settings of ADC ADC in ZETLAB device manager window
Figure 9 — Measuring channels settings in ZETLAB device manager tab
Data view in graphical format is possible by means of oscillograph software that can be started from ZETLAB panel: ZETLAB View → Multichannel oscillograph (figure 10).
Figure 10 — “Multi-channel oscillograph” window
Basic settings of the oscillograph program are as follows (see figure 10): interval – 200 s, frequency – 4 Hz. Using the start/stop key it is possible to start or stop data registering and representation process. The Record key allows to save the data, represent them as graphs, save them to a file in text format.
4. Receiving temperature sensor dynamic chracteristics
Dynamic characteristics of 23.3828 and 27.3828 sensors are revealed in the course of temperature change from room temperature level up to +100 °С. This occurs as the sensors are placed into the boiling water. One can consider this type of impact to be identical to stepwise impact. Connection of the sensor to measuring network is shown in the figures below.
1 — laptop; 2 — ADC module ZET 210; 3 — transistor power supply source; 4 — sensor; 5 — power supply module; 6 — USB cable Figure 11 — Connection of sensor to the measuring system: overview
2 — ADC module ZET 210; 3 — transistor current source; 7 — cables to ADC module ZET 210; 8 — cables to transistor current source; 9 — cables to power supply module Figure 12 — Connection of sensors to measuring system: connection of ADC module ZET 210 and transistor current source
4.1. Sequence of experiment performance
1. Switch on the laptop, wait for operating system loading completion.
2. Using the wires (see figures 11 and 12), establish connection between ADC module ZET 210, transistor current source, sensor and power supply module.
3. Connect ADC module ZET 210 to the laptop by USB cable. Make sure that the LED is green.
4. Change settings of ADC module ZET 210 (see Clause 3, figures 8 and 9).
5. Switch on power supply module.
6. Measure and write down the initial temperature of the sensor, which is equal to ambient air temperature.
7. Boil the water.
8. Start the program “Multichannel oscilloscope” on the laptop.
9. Put the sensor into the boiling water and keep it there untill the transient process is complete (about a minute). Attention! To avoid injuries during the experiment, use fabric gloves.
10. Upon completion of the transient process, click “Stop” key in the “Multi-channel oscilloscope” program. Then click “Record” key and save the process graph obtained to the hard drive.
11. Switch off the power supply module and disassemble the measuring system.
4.2. Experiment results: processing
The purpose of experiment results processing is do determine the transient function of a particular sensor. Since the temperature sensor is characterized by certain response delay, it would be more convinient to use transfer function of aperiodic link: W(p)=k/(Tp+1).
It is convenient to perform results processing in MathCAD (figure 13). Data processing sequence is as follows:
- reading data from the file by means of READPRN function, building the graph;
- finding the graph section with transient process;
- finding transfer ratio k and constant component of sensor’s time T.
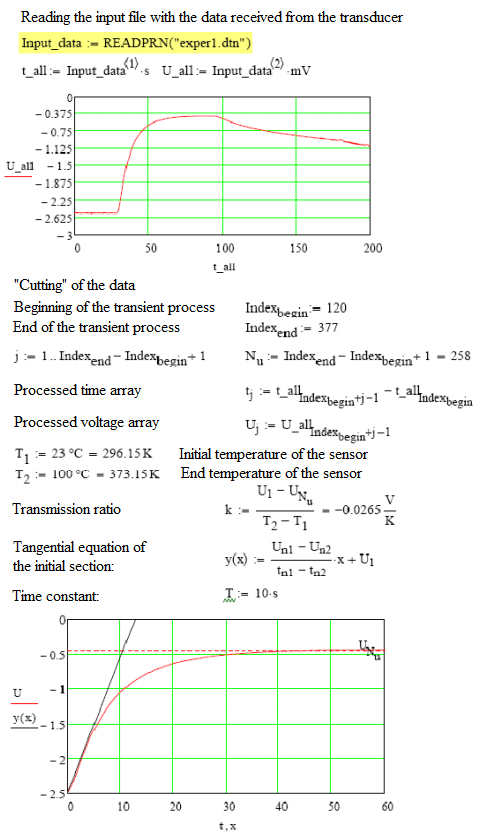
Figure 13 — Program listing in MathCAD for research results processing
For the purpose of more precise adjustment of parameters, it is possible to simulate the research process in MATLAB Simulink (figures 14 and 15). By selecting the transfer function parameters, it is possible to achive high similarity between calculations and actual experiment.
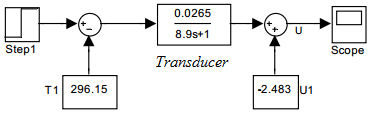
Figure 14 — Simulation of the research in MATLAB Simulink – calculation chart

Figure 15 — Simulation of the research in MATLAB Simulink – sensor voltage graph