Methodics of hydrodynamic and inertial characteristics research
for timber floats made of flat raft sections
Nowadays there are several scientific researches dedicated to hydrodynamic characteristics of flat float units and their arrays. The authors of these articles have obtained algorithms allowing them to determine water resistance impact on flat floating units as well as to calculate the distance between flat floating units depending on floating route bending radius.
Since theoretical research of float units in water is rather complicated (even taking into consideration available technologies), the research has been conducted by means of a specimen (scale 1:20). From previous researches it was clear that this very scale is sufficient to avoid scale effect impact.
Experimental research has been performed in experimental tank at Northern (Arctic) Federal University (Figure 1).
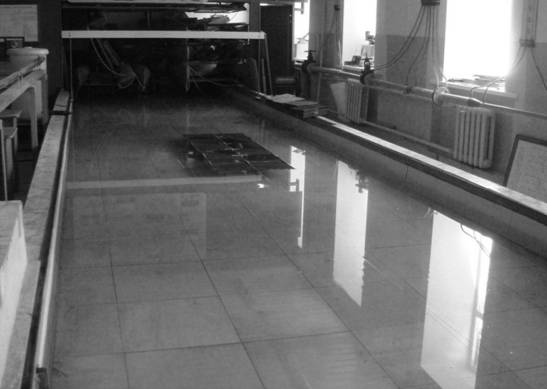
Figure 1 — experimental tank with float model
Experimental tank width – 3 m, length – 14 m, depth – 0,3 m. Ratio of tank depth to float subsidence was variable within 6,5…32. Pulley block was used to create pulling force (iп=3) (figure 2).
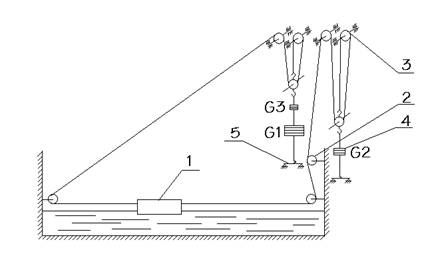
1 — float model; 2 —speed control unit; 3 — pulley block; 4 — weight for braking power; 5 — base
Figure 2 — experimental tank: pulley block scheme
Acceleration and even motion of float model 1 is achieved by means of force (G1+G3–G2)/iп. At the end of even motion period the weight G1 was reaching base 5 and then stopped. The braking force of the model was (G2–G3)/iп. Thus, in each experiment there has been obtained information of three motion modes: acceleration, even motion, model braking. Mass of weight G3, necessary for compensation of friction inside of pulley block, has been calculated in experimental way. Inertial forces of system’s moving parts have not been taken into consideration, since their mass is relatively small if compared to that of the models.
Maximum depth of experimental tank at which there is no additional resistance to float movement has been calculated in accordance with the applicable requirements. It is supposed that the tank depth hб has no impact upon viscous resistance of bundle rafts if the relation of tank depth to subsidence is (hб/T)>8. For the purpose of our experiment, a minimum ratio (hб/T)=6,5 is used for floating units. For quantitative estimation of shalow water impact upon float units motion we shall calculate corresponding ratios.
Wave resistance (resistance of the waves caused by object motion on liquid surface) depends on the depth of the experimental tank in the case if specimen velocity exceeds 0,4√(ghб). In order to observe this condition, it is necessary that the specimen speed would not exceed the value of 0,4·√(9,81·0,3)=0,69 m/s. Maximum specimen velocity in our particular case was not exceeding 0,24 m/s. Thus, the tank depth has no impact upon wave resistance.
Movement of floats models was registered by means of contactless RPM sensor BC401 (figure 3), transferring the data to PC. At the section 2 of the pulley system there is installed a black disc with reflective marks on it (figure 4). As it rotates, the light beam of LED is reflected from the marks of the disc and goes back to RPM sensor receiver. Then the electrical signal is forwarded to PC via amplifier ZET 410 and ADC converter ZET 220 (figure 5). The PC has task-specific software ZETLAB BASE.
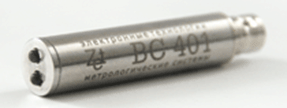
Figure 3 — RPM sensor BC 401
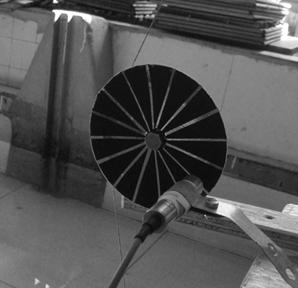
Figure 4 — RPM control module
For the purpose of signals recording received from RPM sensors, we used “Signals recording” program from ZETLAB Software package. Overview of program window is shown in the Figure 6. The key “Record” starts the recording process, “Stop” key stops it. Upon completion of signals recording the information is automatically saved to the hard drive as a binary file.
For the purpose of visual representation of rotation frequency dependence on time as well as tabular representation of the data obtained, one can use “Results view” program also included into ZETLAB software package (figure 7).
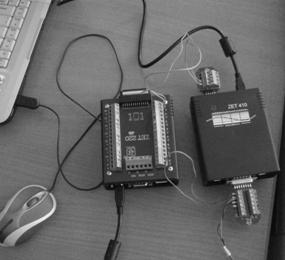
Figure 5 — Differential amplifier ZET 410 and ADC ZET 220
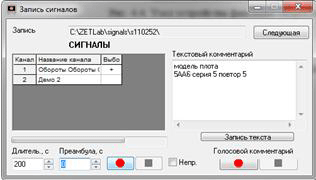
Figure 6 — “Signals recording” program window
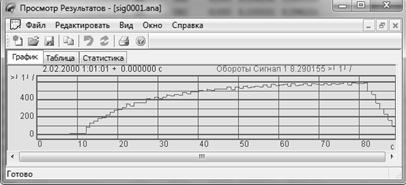
Figure 7 — “Results view” program window
To make the float models, we were using logs with 10…11 mm diameter and (325±2) mm length. Roughness height – 250 µm. For single-layer flat float units the logs were interconnected with brackets. For 3- and 5-layer models the bottom layer is made of a single-layer flat float units and the remaining layers were made of frames filled with logs. The top layer for 3- and 5-layer flat float units is made without frame.
In Figure 8 you can see a float model made of twelve 5-layer flat float units. Model width – 0,65 m, length – 1,95 m, height – 0,052 m. These model dimensions correspond to real dimensions of the float: width – 13 m, length – 39 m, height – 1,04 m.
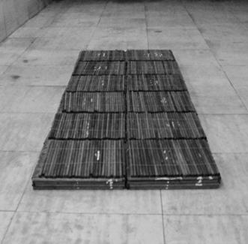
Figure 8 — Float model made of 12 5-layer flat float units
In order to determine the weight of the model we were using scales (with precision up to 1 gr). Model dimensions were measured by steel scale bar with precision up to 1 mm.
The modeling was performed within the range of Froude numbers (0,017…0,095). Reynolds numbers were variable within the range of (0,5·105…3,6·105). The experiments have been conducted at the temperature of 15…16 °С. The models were pulled at different speeds corresponding to natural ones – from 0,35 up to 1 m/s. The amount of experiment replications was 5 in accordance with the applicable recommendations.
Detailed analysis of graphs showing dependence of models velocity on time allows to determine water resistance level at even motion and the time required for acceleration and braking. This information enables effective transport and technological calculations related to timber floating.
Authors: Fedulov V.M., Leonov I.E., Barabanov V.A. (Northern (Arctic) Federal University)
