Connection of current output sensors
to ADC DAC modules ZET 210/220
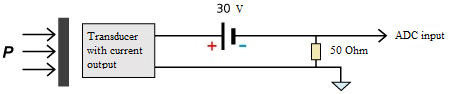
Connection of current-output sensors: two-wired scheme
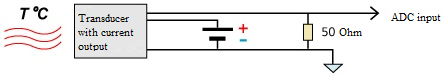
Connection of current-output sensors: three-wired scheme
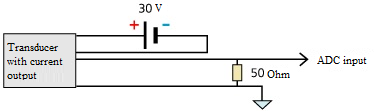
Connection of current-output sensors: four-wired scheme
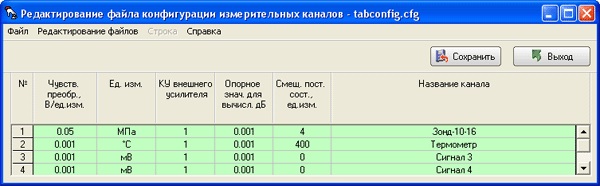
In order to obtain reliable measurements results and to process the signals obtained properly, it is necessary to adjust measuring channels parameters. In order to do that, one have to fill the table in the program “Editing measuring channels configuration file”. The table has the following graphs:
- channel number,
- transducer sensitivity,
- measuring units,
- external amplifier amplification ratio,
- reference value for calculation, dB,
- constant component displacement,
- channel name.
Channels numbers are arranged in numerical order. Transducer’s sensitivity characterizes input value transfer constant (physical) to output value (electrical). The “Measuring unit” graph specifies sensor’s measuring unit (physical value), according to which conversion to electrical value (V) is performed. In the case if prior to analog input there is an external amplifier installed, it is necessary to specify amplification ratio in the table. The reference value for dB calculation is necessary to calculate signal logarithmic level in dB. Constant component displacement should be specified in measuring unit. The last graph – Channel name – contains name of the measuring channel assigned by the user.
Let us consider the following examples of calculating sensor sensitivity and constant component displacement.
Example 1
To the first channel of ADC DAC module ZET 210 there is connected a pressure sensor with DC output signal 4-20 mA, upper measurement limit – 16 mPa. The sensor is powered up from DC power supply source (30 V). To the second channel of ADC DAC module ZET 210 there is connected a high-precision 50 Ohm normalizing resistor (two-wired scheme of sensors connection).
Then at the output of the pressure sensor there will be the following value: 0 mPa- 0.2 V, 16 mPa – 1 V.
Then the sensitivity value is as follows: 0.8 V/16 mPa= 0.05 V/mPa (slope ratio). Set this value in corresponding graph of channel parameter settings.
The distance between the obtained and the real curve by axis of absciss is introduced into the grapf Constant component displacement, measuring unit. Taking it into consideration, the graph of the measuring path will look like in the figure below (first channel – first line).
Example 2
To the second channel of ADC DAC module ZET 210 there is connected a temperature sensor with 4-20 mA output DC signal. The measurement range is from -200 С up to 600 С. The sensor is powered up from DC power supply source (30 V). Parallel to sensor a 50 Ohm normalizing resistor is connected to the input channel of ADC DAC module ZET 210.
Then the value at the output of temperature sensor will be: -200 °С corresponds to 0.2 V, 600 °С – voltage 1 V (black line on the drawing).
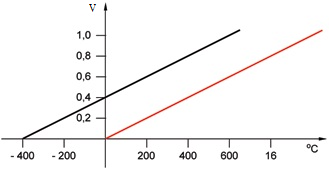
Then the sensitivity value is as follows: 0.8 V/800 °С = 0.001 V/°С (slope ratio). After having set this value in corresponding graph of channel parameters settings, we shall see a red curve on the drawing shown below.
The distance between the obtained and the real line is to be set in Constant component displacement, measuring unit graph. Taking this into consideration, the graph of the measuring path will look like in the figure below showing the configuration file appearance (second channel – second line).