
Connecting ZETSENSOR to TRACE MODE
through OPC server
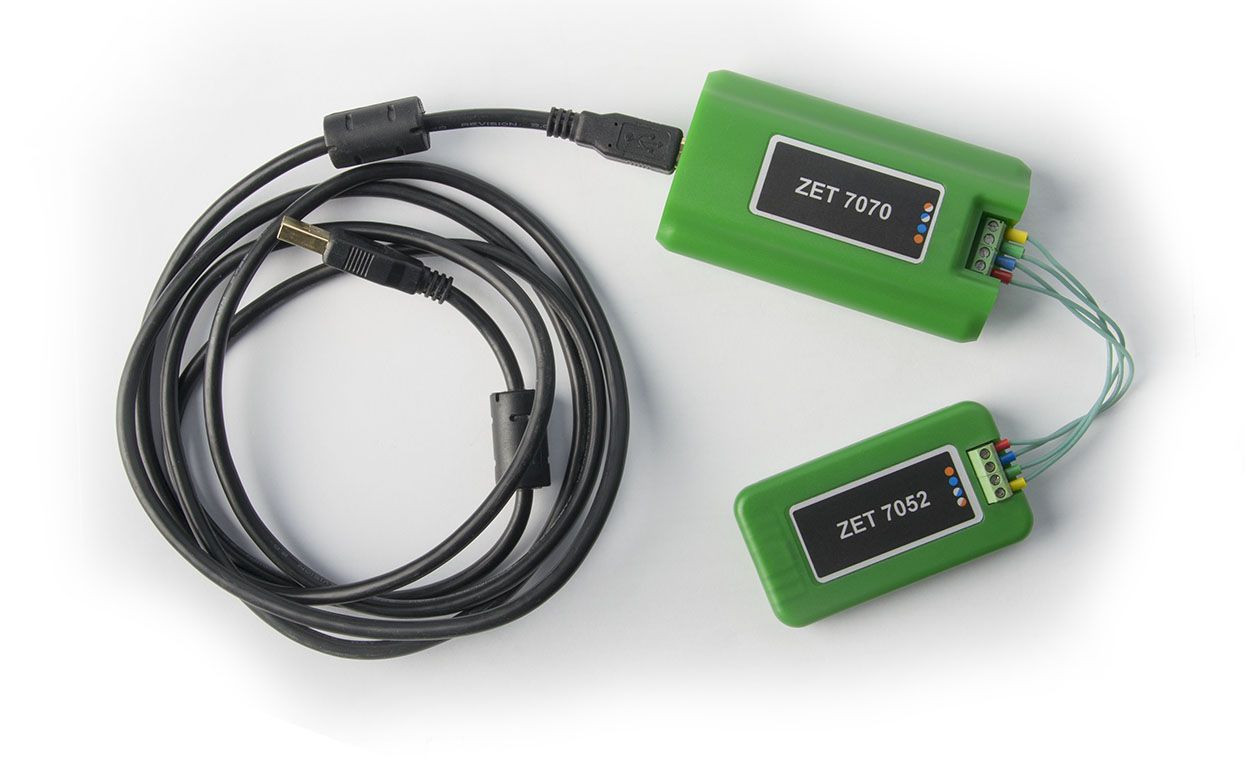
Figure 1
First, configure the ZET.7xxxOPC OPC server to work with the selected devices. Launch the SensorWork program included in the sensor package, search for the devices (Figure 2), activate OPC server mode (Figure 3), check the data in the OPC tags (Figure 4), close the “Work with OPC server” window, configure the program to launch in OPC server mode for the next time (Figure 5).
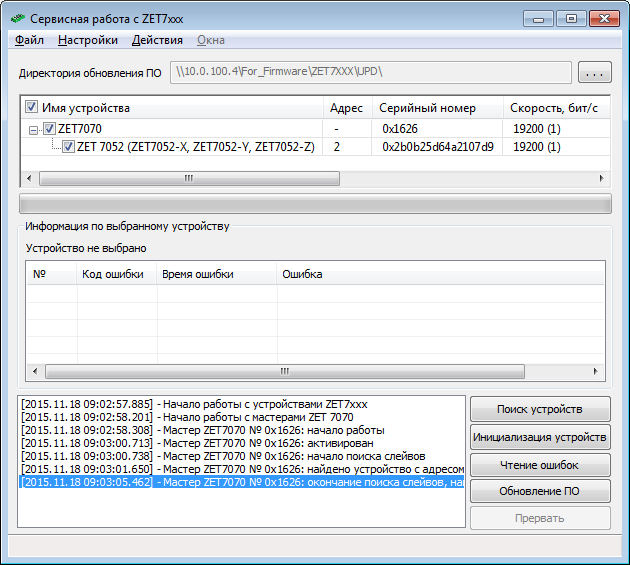
Figure 2
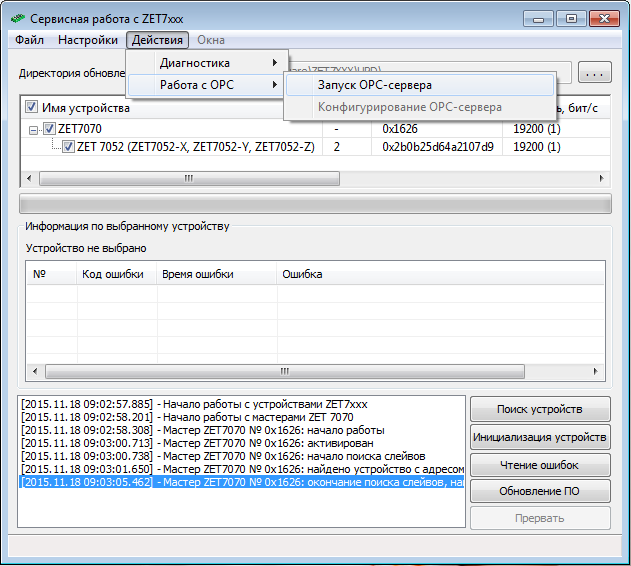
Figure 3
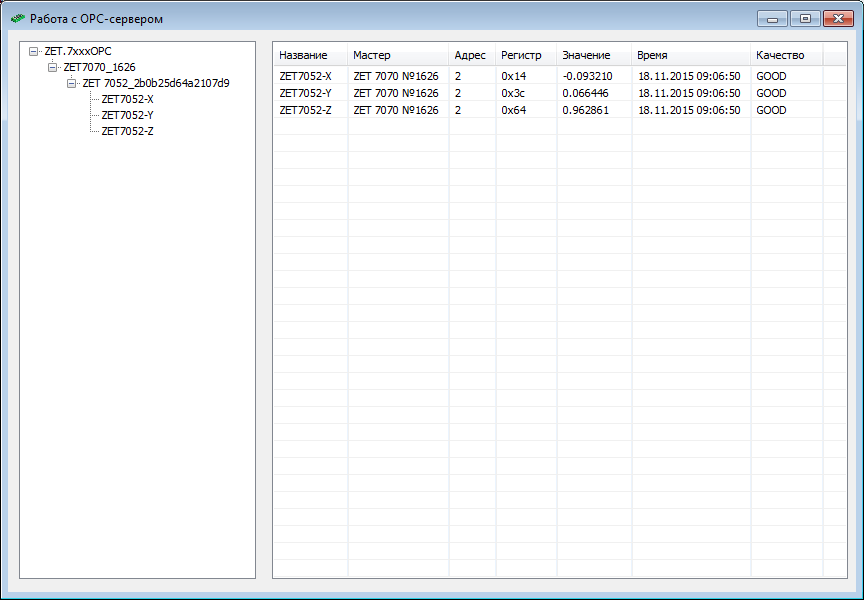
Figure 4
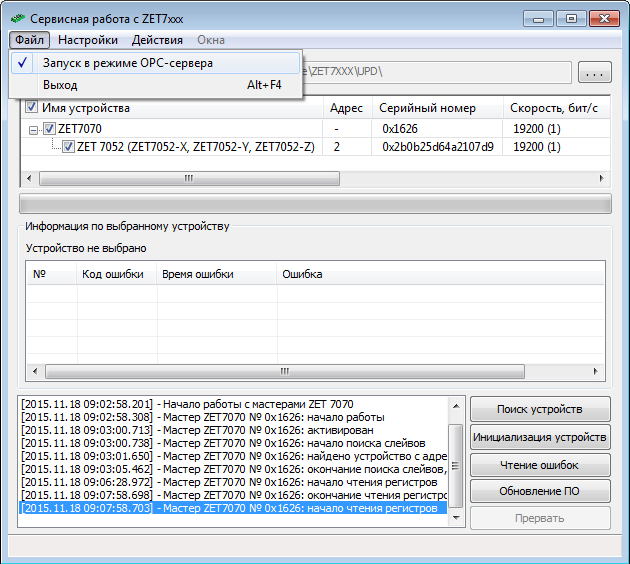
Figure 5
Then, proceed as instructed in the training video demonstrating equipment connection via the integrated OPC client of TRACE MODE (www.adastra.ru/products/drivers/opc_connect/):
1) Add OPC group to the “Sources/Receivers” and create OPC_server group. Create three OPC components (for X, Y, and Z axes of the linear acceleration sensor) in the OPC_server group to read tags. Configure each component (Figures No 6, 7, 8). Take the sensor axis name as the name. In the “Server” row press “Overview” button, select ZET.7xxxOPC server from the list of available OPC servers and the relevant tag for reading. Switch the mode to ADVISE. All other settings should remain unchanged.
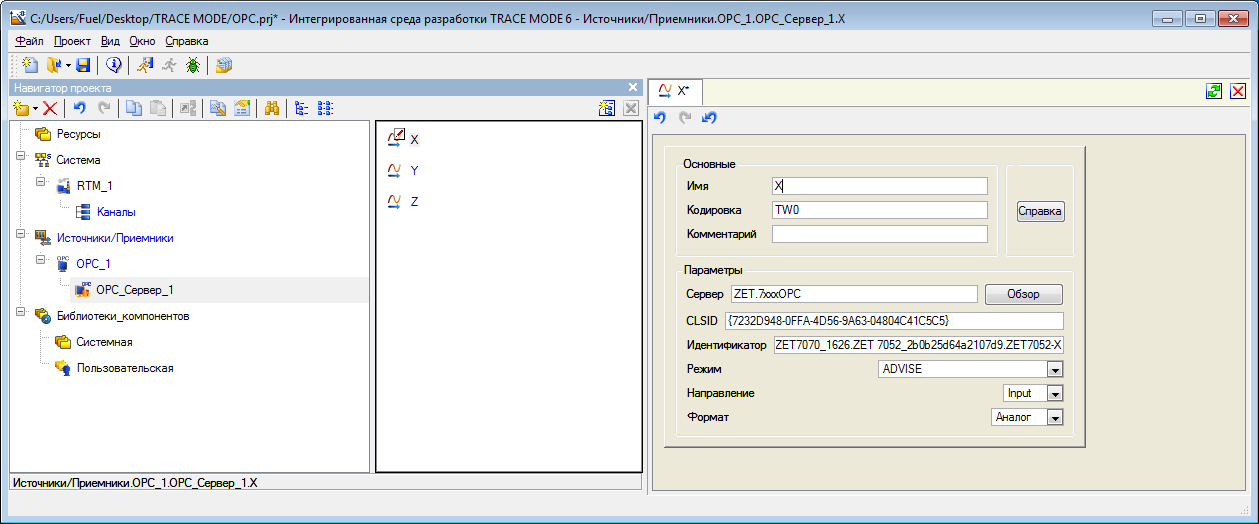
Figure 6
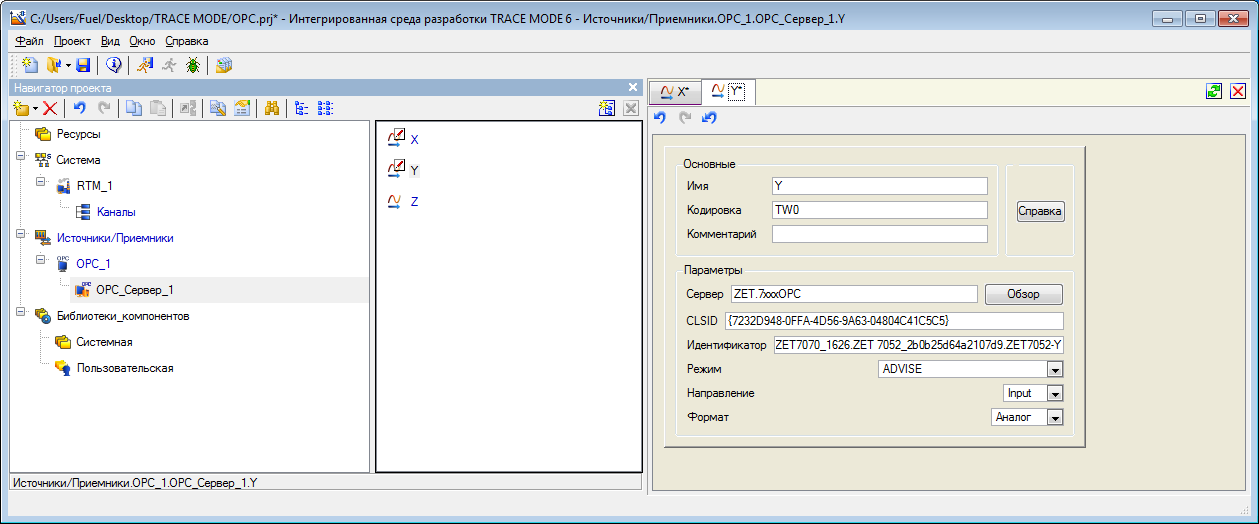
Figure 7
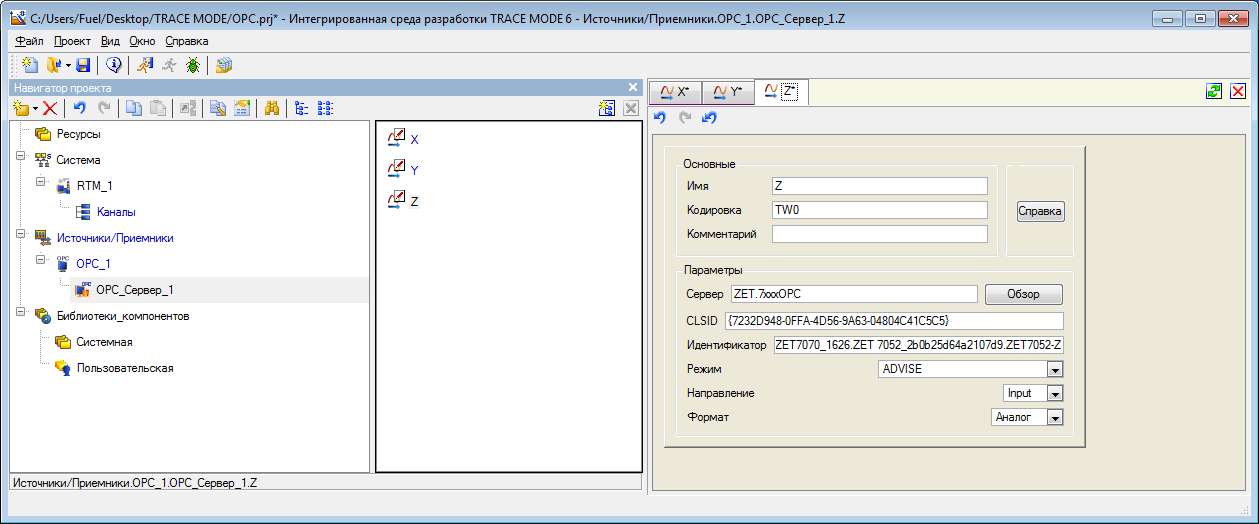
Figure 8
2) Move the three created components to the “Channels” group of the “RTM_1” node (Figure 9). The settings of each of the three TRACE MODE channels should remain by default.
3) Configure the work display to show three text fields where the current sensor reading will be displayed, as well as the trend for tracking the acceleration values dynamic over time (Figure 10).
4) Save the project to the hard drive and for the real-time monitor. Start the profiler. The result of operation is shown in Figure 11 (sensor position in space was changed during the recording).

Figure 9
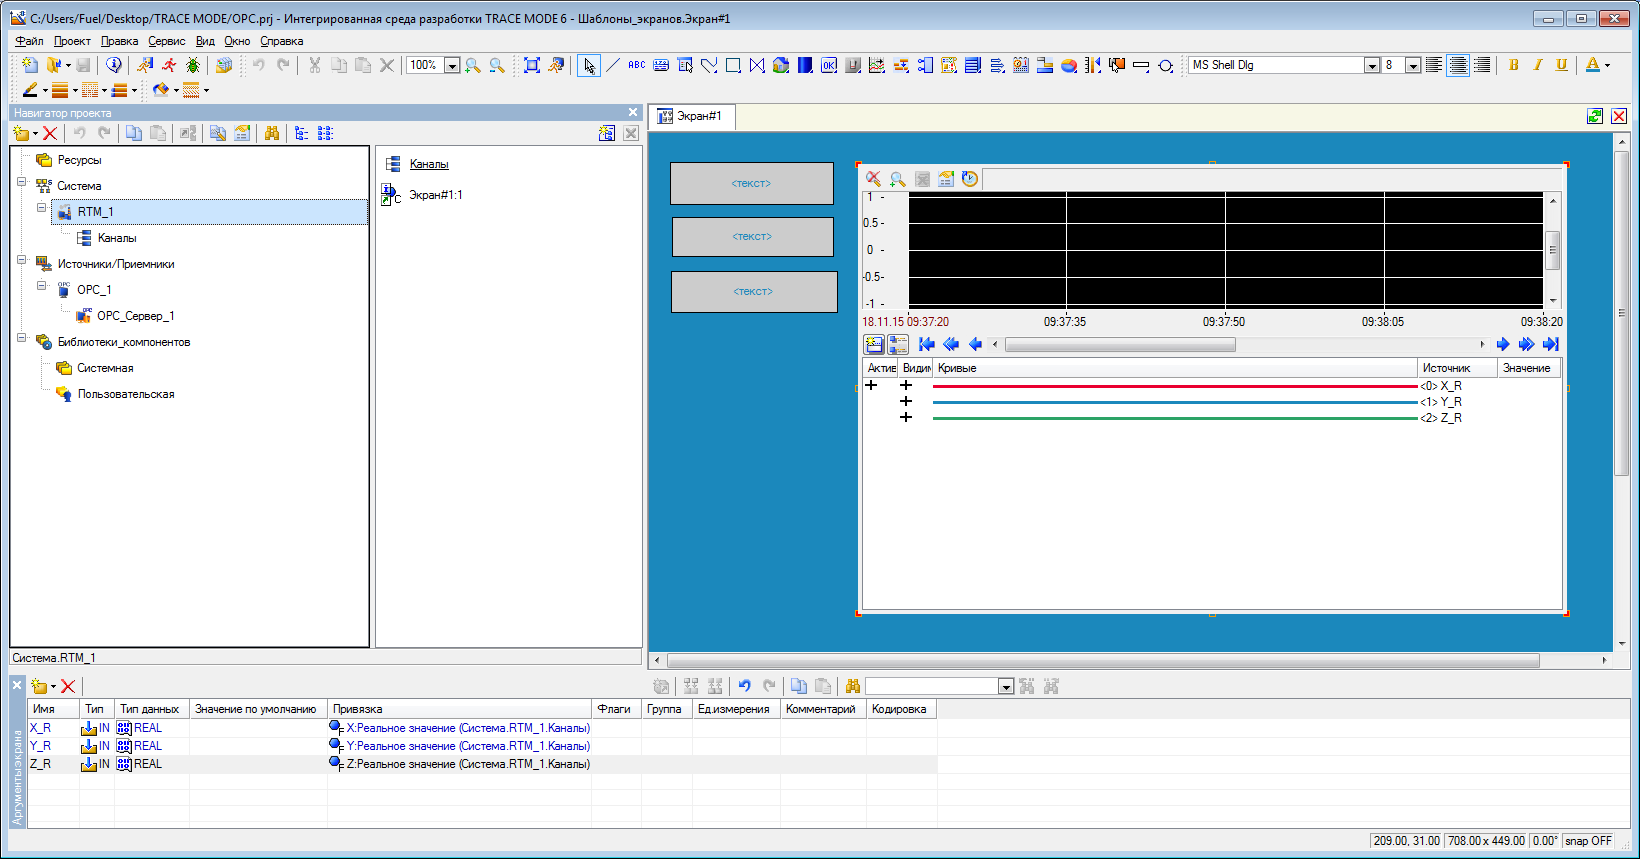
Figure 10
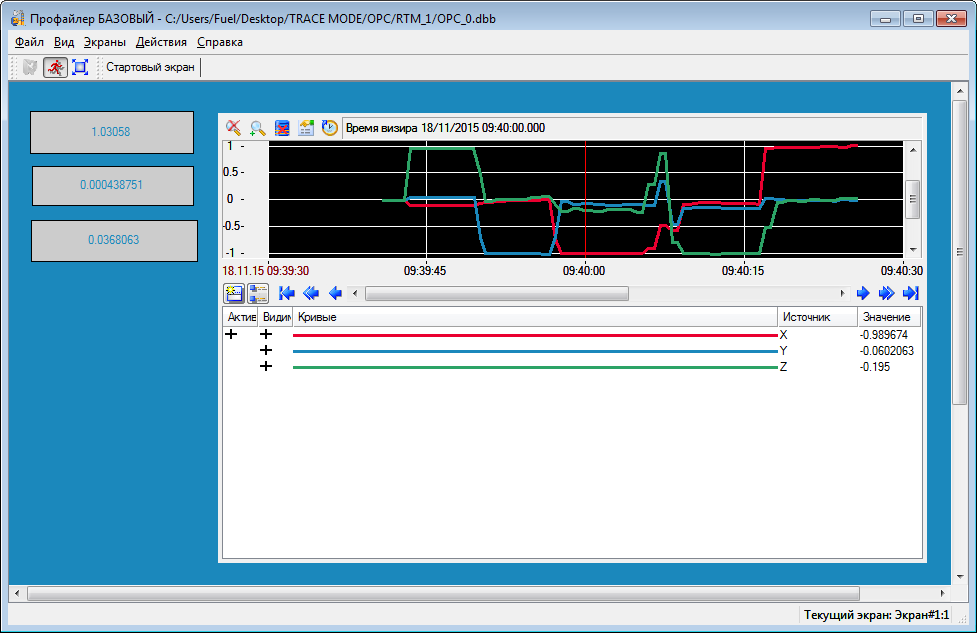
Figure 11