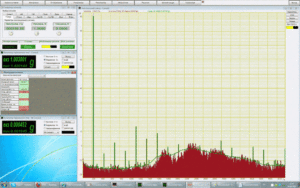
ZETLAB Shaker control system: basic parameters, measurement results
ZETLAB Shaker controller system consists of:
- vibration machine (shaker/vibration exciter),
- primary transducers (acceleration sensors),
- FFT spectrum analyzer performing generator and voltmeter functions,
- Special software ZETLAB shaker controller.
Below you can see the system characteristics based on BC 133 shaker system and FFT spectrum analyzer ZET017-U4.
Input channels number
- 4 or 8 synchronized input channels.
Types of vibration sensors connected
- Charge output accelerometers.
- Accelerometers with IEPE power.
- Vibration meters with current output and instant values.
- Sensors with standard current output 4-20 mA.
- Velocimeters.
- Displacement sensors.
Vibration measurements frequency range
- From 1 Hz up to 10 kHz.
Output signal dynamic range
There are several characteristics of dynamic range measurements:
- SNR (Signal to Noise Ratio) — the ratio between signal and noise
- SFDR (Spurious Free Dynamic Range) — dynamic range without spurious components
- SINAD (Signal to Noise Distortion Ratio) — signal ratio / (noise+ distortions)
- THD (Total Harmonic Distortion) — total harmonic distortion coefficient (non-linear distortion coefficient)

SNR is calculated as a ratio of base signal RMS to a signal without the first five harmonic components and a constant.
Two AC voltmeters are used for measurements – the first one measures the signal RMS, the other one – the filtered signal RMS. HF filter with a cut-off frequency over 6-th harmonic components automatically eliminates the first five harmonic components and the constant.
SFDR is calculated as a ratio of carrier frequency RMS to noise harmonic component RMS (or spurious components RMS).
The Software LPF (Low-Pass Filter) enables value representation in dB, which considerably simplifies the calculation process. Amplitudes ratio can be substituted by the logarithmic differential. Then it is possible to deduct maximum dB value of the remaining spectrum from the basic harmonic component value in dB. As you can see from the figure, it is the 5-th harmonic component that has the maximum value.
SINAD can be calculated in two ways:
- As a ratio of total signal power to the total noise and distortions power
- As a ratio of carrier frequency to noise and distortion power after signal switch-off.
THD is calculated as a ratio of all input channels spurious harmonics RMS to the basic harmonic component amplitude:
The Software “Non-linear distortion analysis” enables calculation of the harmonic distortions total ratio and representation of its value in dB
Amplitude measurement basic tolerance
In accordance with verification procedure “FFT spectrum analyzer ZET 017”:
- ±(0,005Uh + 10,0 mV) up to 7 V pre-amplification coefficient = 1
- ±(0,005Uh + 1,0 mV) up to 0,7 V pre-amplification coefficient= 10
- ±(0,005Uh + 0,1 mV) up to 0,07 V pre-amplification coefficient= 100
If 1 V corresponds to 120 dB, then the relative tolerance should not exceed 0,13 dB.
In accordance with the applicable Technical regulations, vibration measurements relative tolerance should not exceed 1,1 dB.
Non-linear distortion coefficient
In accordance with the applicable Technical regulations, non-linear distortions coefficient should not exceed
- 0,1%.
Galvanic separation
- no.
Number of output channels
- 1.
Output channels coupling
- Independent channel aligned with the main one, feedback provided by a random sensor.
Signals reproduction frequency range
- 0,03 … 20000 Hz.
Signals reproduction frequency range
Non-linear distortion coefficient in linear and dynamic ranges
In accordance with the applicable Technical regulations, non-linear distortion coefficient should not exceed
- 0,1%.
Output channel galvanic separation
- No.
Available algorithms of the controller
- Sinusoidal vibration.
- Broadband random vibration.
- Classical shock.
Additional controller algorithms
- Narrowband spectrum.
- Non-linear distortions measurements.
- Integrator for calculation of vibration speed and displacement.
- Differentiator for calculation of vibration speed and displacement.
- Frequency response and phase-frequency response measuremets.
- Non-linear distortions phase dependence measurement.
- Amplitude flatness evaluation.
- Resonance parameters measurements, intrinsic frequencies, reactance factors.
- Random signals distribution – diagram construction.
- Triaxial sensor oscillations vector control.
Input channels: processing methods
- By single channel.
- Average level by several channels.
- Maximal level by several channels
- Matched filtering by several channels.
- Data processing in accordance with a certain formula.
Protection by limit values
Yes.
Maintained resonance: reactance factor
Since we know that the resonance reactance factor is equal to the difference of relative frequencies with the signal value equal to 1/√2 of the resonance value:
Sinusoidal vibration: sweep speed
Sine sweep: signal rise and fall limit speed
Broadband random vibration probability density deviation from Gaussian distribution
System operation: signal / noise ratio
Controller location, connection to PC.
- Via USB bus – up to 2 m.
- Galvanic separation of controller and PC.
- Possibility of placing the controller within the testing area.
- Controller version: IP 54 or IP 68.
50-60 Hz line interference impact on controller’s operation
- No impact.


