
Evaluation of wood elasticity modulus
in compliance with the method “Wood. Resonance method of MOE and oscillations damping evaluation”.
For the purpose of wood MOE evaluation, there is used a resonance method, described in the relevant document “Wood. Resonance method of MOE and oscillations damping evaluation”.
The essence of this method is based on excitation of a sample with lateral oscillations of the first harmonics and bending oscillations of the second harmonics. Using the resonance frequencies values, it is possible to calculate elasticity modulus and shear modulus, while the width of resonance peaks is used for calculation of logarithmic damping ratio.
Thus, in order to evaluate dynamic MOE, we need to know the precise value of sample’s latteral oscillations frequency.
Specialists of ZETLAB Company have conducted an experiment of resonance frequemcy evaluation with the use of ZETLAB measurement instruments and software.
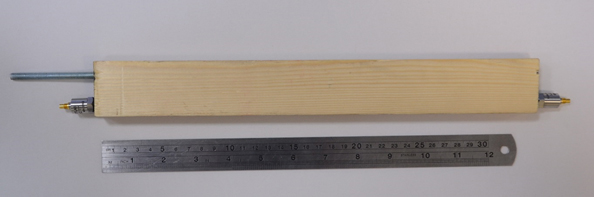
As a specimen, there was used a wooden block (35 mm length):
Components of the test system
In order to measure the resonance frequency of the specimen, you can use a system, which includes the following components:
1) Shaker system TV 51140
2) Shaker controller ZET 028
3) Accelerometers BC 111
4) PC with ZETLAB software used for the processing of the test results.
The specimen is mounted on the shaker table with the use of a mounting rod attached in lateral direction.
The accelerometers are mounted on the flat ends of the specimen:


Tests performance
Shaker controller ZET 028 and the shaker system are used for applying vibration to the specimen.
The signals received from the accelerometers undergo processing in the program “Cross narrowband spectrum“. Thus, it becomes possible to conduct analysis of physical systems’ frequency characteristics as these systems are influenced by external excitation.
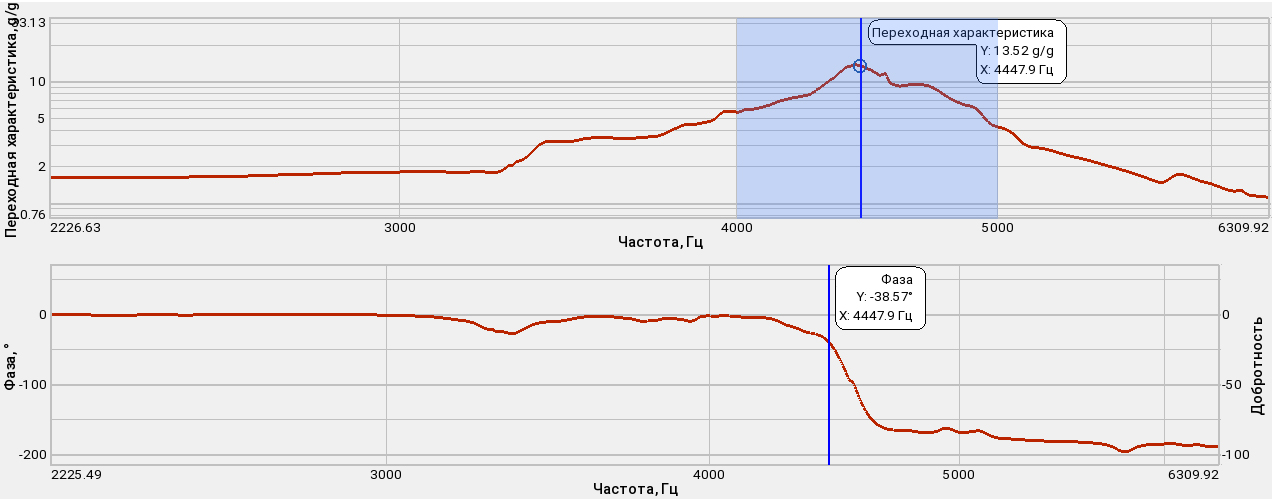
Evaluation of frequency characteristics is shown in the graphs below:
1) The graph shows amplitude and phase characteristic of the specimen under test. As you can see, the amplitude characteristic has a clear peak at the frequency of ∼ 4447,9, while the phase characteristic is also changing at the same frequency. These factors indicate the first mode of the specimen, which will further be controlled.
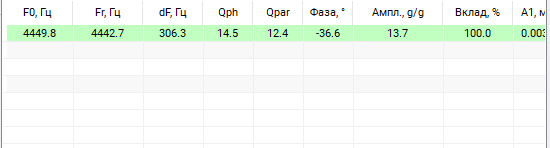
2) This table registers the resonance frequencies, and is also used for calculation of additional parameters, that correspond to the relevant oscillation mode:
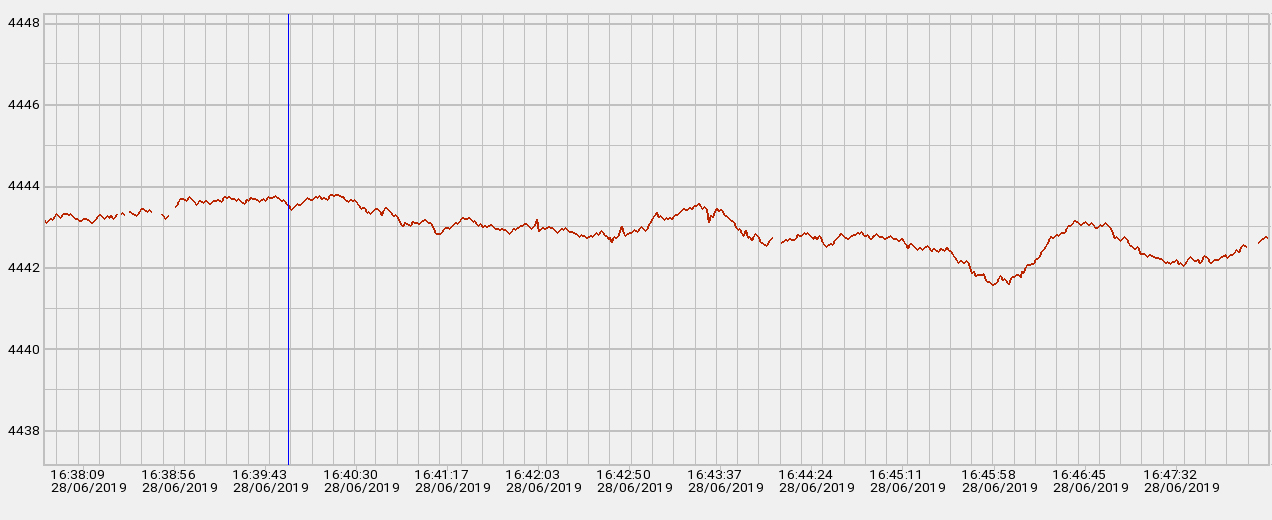
3) In the course of tests performance, the recorder saves all registered values of specimen’s resonance frequency. From the below graph, you can see, that the resonance frequency throughout the test duration (10 minutes) has been defined with high precision (error less than 0,1 %).
Further processing of the results is conducted with the use of calculations.
The elasticity modulus (MOE) is calculated by the following formula:
![]()
where b, h, l stand for width, height, and length of the specimen (m)
m is the weigth of the specimen, kg
f is the resonance frequency, Hz
β is a correction for weight of the attached transducers and the mounting rod, which is equal to the specimen weight with the additional weight, to the weight of the specimen.
The experiment shows, that hardware and software by ZETLAB Company allow to evaluate the required characteristics with high accuracy degree, as well as to calculate wood resonance frequency, and, hence, the elasticity modulus (MOE).