
Diagnostics of gear units
Based on spectrum of vibration signal
One of the most common methods of analyzing vibroacoustic signals is a spectrum analysis with a uniform or logarithmic frequency step. The method consists in decomposition of a signal into a set of harmonic oscillations. As an example, let’s consider the signal incoming from a vibration pickup installed in the zone of gear units spinning. Figure 1 represents a power spectrum of signal with a uniform frequency step within a frequency range up to 100 Hz. The frequency step and, hence, a frequency resolution of spectrum analysis is 0.12 Hz. The spectrum is calculated using a program “Narrow-band spectrum analysis”.
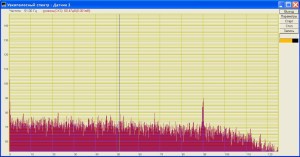
Figure 1
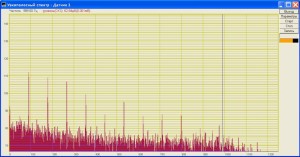
Figure 2
The graph shows a peak at a frequency of around 90 Hz. This frequency corresponds to a shaft speed of 5,400 RPM. Availability of this frequency peak in the signal spectrum of vibration pickup suggests beats that occur at each revolution of shaft. There can be several reasons. For detection of the principal source of beating at the shaft frequency, it is necessary to install the sensors next to the shaft bearings and compare the obtained spectra. Moreover, it is necessary to compare the spectra of signals from the reference sensors standing on the bearing supports of service mechanisms to make sure that the signal at 90 Hz is not induced by other mechanisms. Figure 2 presents the signal spectrum with a uniform frequency step within a frequency range up to 1,000 Hz.
A frequency resolution of spectrum analysis is 1.2 Hz. This figure contains the peaks at frequencies 90, 180, 270 and so on at the frequencies divisible by 90 Hz. The frequency peaks up to 9th harmonics of 90 Hz can be clearly observed. Availability of harmonics of the reference frequency shows that oscillations or beats do not occur according to a harmonic law. Availability of even harmonics 2, 4, etc. suggests asymmetric oscillations. Figure 3 presents the signal spectrum with the uniform frequency step within the frequency range up to 10 kHz. The frequency resolution of spectrum analysis is 48 Hz. The peaks of shaft frequency and its harmonics are no longer visible on this figure. But within this frequency range of spectrum analysis the gear frequency in the vicinity of 3 kHz and harmonics at the frequencies of 6 and 9 kHz appear. For assessment of the shaft rotation frequency the signal from the RPM sensor and its spectrum can be used.

Figure 3

Figure 4
Figure 4 shows the signal spectrum of RPM sensor with the uniform frequency step within the frequency range up to 100 Hz. The frequency step and frequency resolution of spectrum analysis is 0.12 Hz. The frequency peaks in Figures 1 and 4 are the same, and it confirms the fact that vibration is connected with the shaft rotation.
In many cases, it is convenient to present the spectrum with a logarithmic frequency step. Figure 5 illustrates the power spectrum of vibration pickup’s signal, the frequency step is 1/24 — octave, the width and frequency step account for 3% of the frequency value. This type of signal spectrum presentation allows observing the low and high frequencies simultaneously. On the left side of the figure the frequency peaks of shaft frequency and its harmonics 90, 180… can be seen, while on the right side of figure the frequency peaks of gear frequency and its harmonics of 3, 6 and 9 kHz are shown. The spectrum is calculated using the program “Octave band spectrum analysis”.

Figure 5
Control and screening test of the gear units can be performed according to the levels of spectral components of fundamental and divisible harmonics of shaft and gear frequencies.
See also:
- diagnostics of gear units;
- diagnostics of gear units based on super narrow-band spectrum;
- diagnostics of gear units based on co-spectrum characteristics;
- diagnostics of gear units based on inter-correlation characteristics;
- diagnostics of gear units based on spectrum of envelope curve;
- diagnostics of gear units based on order normalization.