SCADA-project
Buildings and constructions structural monitoring system
The Software is supplied within the scope of Buildings and constructions structural monitoring system also referred to as SHM system.
SHM ZETLAB is a scalable system with a possibility of expansion up to 500 measuring channels.
From 2 451 USD
* The price is quoted for a standard SCADA-project including up to 10 measuring channels with complexity index -1.
Increase in the amount of measuring channels leads to a higher complexity index.
Project price is calculated based on the complexity index.
Data processing and analysis
ZETLAB Seismo supplied within the scope of seismic recording system software set enables comprehensive analysis performance including:
- visual representation and analysis of registered signals using various digital processing algorithms for time and frequency parameters analysis;
- choice of separate signal sections having optimal signal/ noise ratio. 3D-signal representation analysis (3D-spectrogram) depicting signal frequencies spectrum changes;
- intrinsic frequency, shock spectrum and intrinsic oscillations basic tone logarithmic decrement calculation;
- signals trends elimination (for minor changes);
- source signals recording, measurements results acquisition for further representation in digital and chart format.
Data storage and reports generation
Archive creation “Multichannel recorder” software is used for signals parameters continuous recording. The data are recorded as “.dtu” file that can be view by ZETLab “Results view” and “Signals gallery” programs as well as by text editor.
Database creation “Signals recording” is used for source signals recording software. Signals recording enables storage of structured files, comments, and measurement parameters. User settings and measurement results are included into the database as well. The database is recorded as a binary file. When a database is recorded, there are two files to be saved on the disk: database binary file and informational text file. These files have the same names and different extensions. The «.txt» informational file contains comments to database and complete measurement files list.
Actual results saving To save the results in “Multichannel oscillograph”, “Narrowband spectrum”, “Mutual correlational analysis” and similar programs having graphical representation window, use the “Record” key located in the right interface section of the program. Oscillograms, spectrums, spectrograms and other graphical information can be copied to the clipboard by “Ctrl+C” command to be further included into tests protocols.
Reports creation In order to automatically create a report using certain template one can use “Report” or “Excel document” element of SCADA ZETVIEW. The report file may contain digital or graphical information as well as comments on measurements results.
Software component
The software component is established in ZETView graphical programming environment and is represented by a SCADA-project (source code represented as a mnemonic scheme) and executive file. The software has four windows:
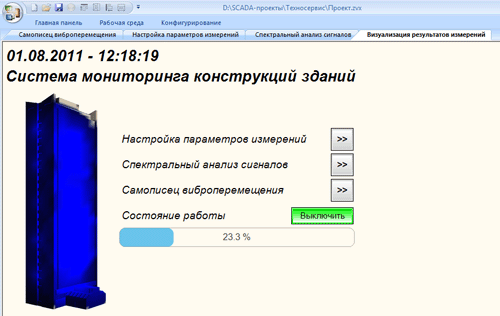
Measurement results visual representation
Measurement results visual representation window is used for tested building structure display as well as for measurement process start/stop. In the course of experiment performance depending on the impact hardness detected by corresponding sensors, the virtual model changes its color scheme. The color is proportionate to the impact hardness (in particular, to the vibrational displacement value) at the sensor mounting point (besides the vibration displacement value the program settings also allow to control vibration speed and acceleration). The corresponding key allows to start and stop the measurement process. Upon activation of “Measurement parameters settings”, “Signals spectral analysis” and “Vibration displacement recorder” the program depicts the corresponding window.

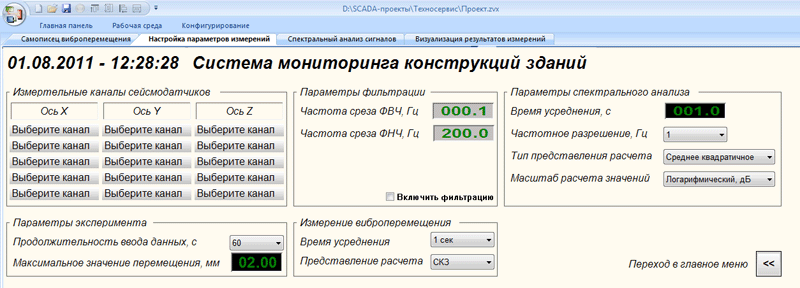
Measurement parameters settings
“Seismic sensors measuring channels” section allows to set compliance of measurement channels to actual signals. In order to set a channel, one should activate the corresponding menu and choose the particular channel from the dropdown list.
“Filtration parameters” section has band filter settings menu. Using the key “Activate filtration” one can switch on/ off the signals bandpass filtering. The fields “HF filter cut-off frequency” and “LPF cut-off frequency” are used to set filters cut-off parameters of high and low frequencies correspondingly.
“Spectral analysis parameters” section is used to set FFT spectrum analyzer parameters. Averaging time of instant spectrum is set using the switch “Averaging time, sec”. “Frequency resolution, Hz” is used to set FFT spectrum analyzer current resolution. “Report representation type” section allows to view results as spectral density, spectral power, RMS and crest factor value. “Values calculation scale” is used for spectrum calculation results representation in logarithmic scale (in relation to the base value for dB calculation) and in linear scale (in measuring values).
“Experiment parameters” section has two elements: “Data input duration, sec” and “Maximum displacement value, mm”. The first element allows to control the experiment duration, to set signals recording time, as well as to set averaging time value for signals instant spectrum. The second element allows to set the value in relation to which the building model color will be selected.
“Vibration displacement measurement” enables vibration meter settings – averaging time (“Averaging time” element) and report representation type (RMS, crest factor and amplitude value) – see “Report representation” element.

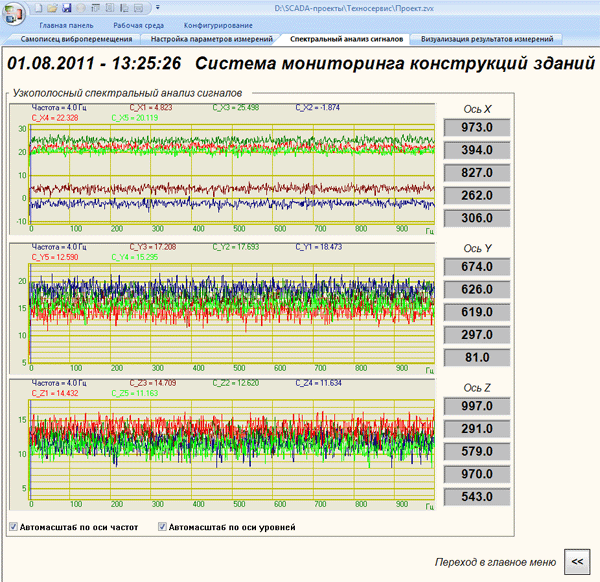
Signals spectral analysis
This window is used to depict signals spectral analysis results. The three diagrams show X, Y and Z signals spectral components of the seismic sensors as well as maximum spectral value for each of the sensors.

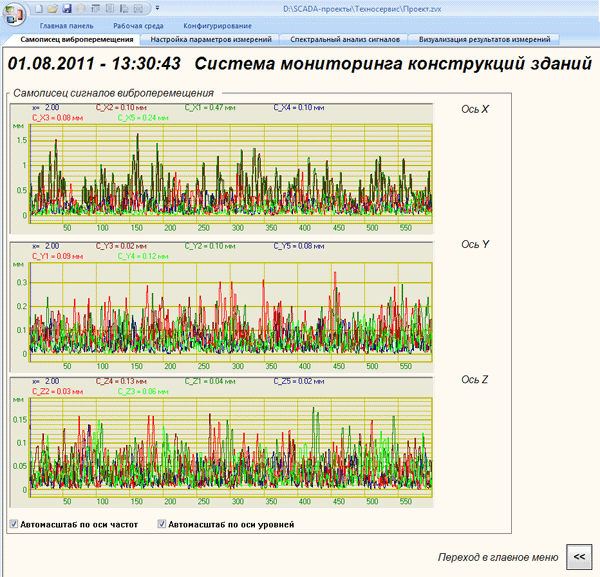
Vibration displacement recorder
This window is used to depict vibration displacement values of each sensor’s components.

