
Cross-Correlation Analysis
The software is used for correlation analysis of signals coming from the input channels of FFT spectrum analyzers in real time or recorded time realization view mode, as well as for viewing various correlation characteristics of signals. Correlation analysis is a set of methods based on the mathematical correlation theory and is used for detecting the correlation dependence between two random attributes or factors. For solving a number of diagnostic tasks, cross-correlation analysis of signals in two or more control points distributed across space is often used.

Cross-correlation signal analysis is often used for detecting a weak signal in the environment of strong static unbound interferences, as well as for determining thspatialce coordinates of their source based on the time shift value. It facilitates the detection of not only narrowband signals but also correlated random broadband signals, which is why it is successfully used, for instance, for searching leakage in pipelines based on noises occurring in the leakage area and spreading across the liquid (gas) flow.
It should be noted that spectral methods are used more often than the correlation methods for leakage detecting, since cross-spectral analysis of stationary processes provides more information (see “Cross-spectral narrowband analysis” and “Cross-spectral fractional-octave analysis“). But cross-correlation analysis is more effective in the spatial detection of non-stationary processes, including impulse ones, and can be used for detecting and determining the coordinates of acoustic emission sources in uniform loaded metallic structures.
Main Software Features and Parameters
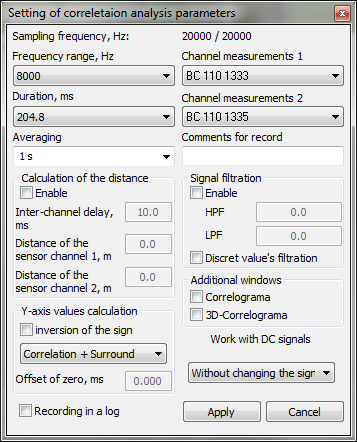
- analysis frequency range: 0…1, 0…10, 0…100, 0…1,000, 0…10,000 Hz
- analysis duration: 5 ms to 10.5 s;
- averaging time: 0.1 to 10 s;
- performance of cross-correlation signal analysis in various frequency bands;
- possibility of digital signal filtration;
- measurement and display of diagrams of the maximum and average values as well as the envelope curve;
- measurement and display of 2-/3-dimensional correlograms;
- calculation of distances based on the differential delay of signals;
- saving the program settings and restoring them for subsequent starts.
Supported Hardware
Input data for Cross-correlation analysis are represented by digital data of ZETLAB server channel.
Cross-correlation analysis is included into the following software packages:
- ZETLAB ANALIZ – FFT spectrum analyzer software
- ZETLAB VIBRO – Shaker controller software
- ZETLAB SEISMO – Seismic station software
Cross-correlation analysis is included in the Signal analysis software group.