Sinusoidal vibration
Software application Sinusoidal vibration is used for testing products resistance to vibration impact at different frequencies and ranges. It is included into software complex ZETLAB VIBRO, supplied together with VCS ZET017-U. The program is available in VCS menu of ZETLAB control panel.

The primary program window depicts the main menu. In the clause «View» there are subclauses «Transfer characteristic» and «Control ratio». Subclause «Transfer characteristic» controls depiction of «Transfer constant» indicator as well as «Maximum transmission rate» and «Minimal transfer constatnt» regulators. Subclause «Control» controls «Coefficient of start-up mode» and «Control coefficient» regulators. Transfer characteristics regulators are depicted upon program activation while control coefficient regulators are not. Transfer coefficient is calculated as a ratio of current acceleration value to the DAC output voltage. By default, the maximum transfer coefficient is equal to 1.0, (minimal value – 0.0001). The coefficients are adjustable within the range 0.0000 – 9.0000. Mode activation coefficient by default is equal to 1.3, while control coefficient is 5.0. The coefficients are variable within the range of 1.000 – 9.000.
“Coefficient of start-up mode” determines the speed of signal acceleration upon beginning of the test. The higher the ratio is, the faster increases the signal amplitude (and vice versa). If the coefficient is equal to 1.000, the system will never activate the set mode. If the coefficient is over 2.000, the system may switch over to the mode too fast and exceed the acceptable profile parameters or start processing strong oscillations. It is highly recommended to set mode activation value equal to 1.3.
“Control coefficient” determines the time necessary to eliminate the difference between the required and current acceleration. The higher the coefficient is, the more time it takes for the system to set back the control parameter to the set profile value. In the case if the control coefficient is less than 3.0, there occurs overshoot effect. The effect leads to fluctuations of the control signal around the profile value and may result in control signal values exceeding the acceptable values. If the control coefficient is more than 7.0, the control signal deviates from the set profile value in one direction. The higher the control coefficient, signal deflection speed and signal amplitude change speed are, the higher will be the value of deviation.
It is not recommended to use control coefficient other than 5.0 (it is allowed to increase the control coefficient value in the case of antiresonance presence in the tested object).
Vibration tests can be started by setting all the necessary parameters.
Tests performance
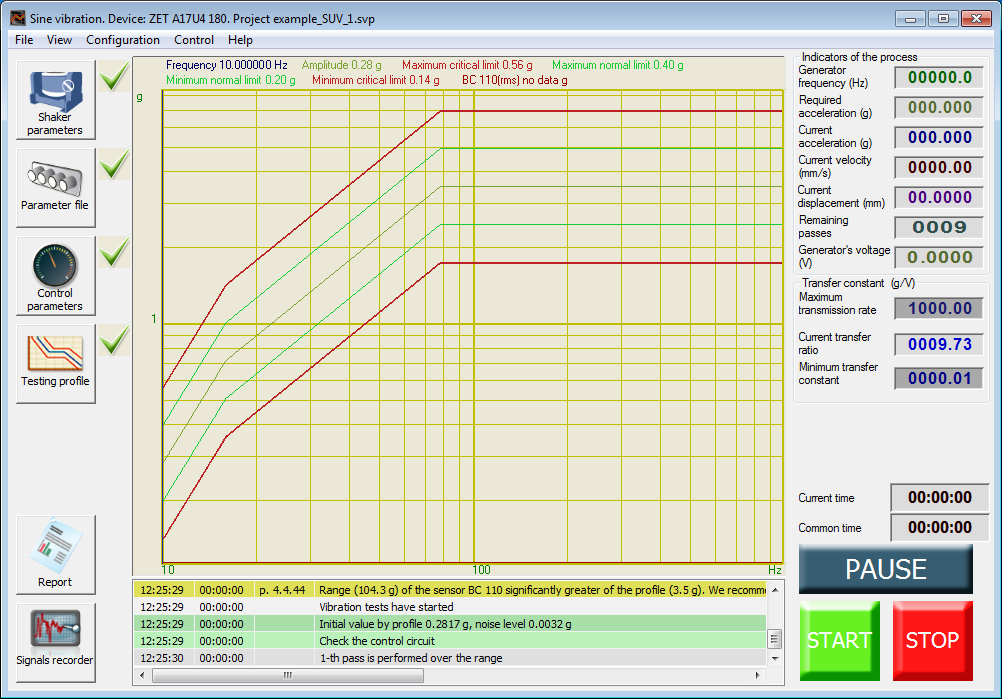
The chart depicts vibration test profile – “Amplitude“, critical limits – “Maximum critical limit” and “Minimum critical limit“, normal limits – “Minimum normal limit” and “Maximum normal limit“, sensor diagrams (the figure depicts diagrams of “BC 110” and “BC 112” sensors), control diagram (in the case if the control is performed by several sensors). The diagram has moving vertical line – a marker. The marker shows current frequency of signal generation. Instant values of all specified diagrams and current frequency value are displayed above the diagram area.
In the right section, one can see current status indicators of vibration tests. They depict current sinusoidal signal generator frequency; required current acceleration; current vibration acceleration, vibration speed and vibration displacement of the controlled sensor; the number of remaining iterations, attenuator value. Transmission coefficient indicators are located below. Indicators on the dark background allow setting maximum and minimal transmission ratios. These values can be adjusted. Between them, one can see indicator depicting current transmission coefficient. Should the transmission coefficient values fail to correspond to the set limits, the vibration tests shall be stopped.
Time indicators are located below; “relative time” shows the time from the start of vibration tests, “absolute time” – the time required to pass all the profile segments in one direction. Below one can see two operator notification windows.
Vibration tests start upon “Start” button activation. The primary output is for the 30-40 sec mode. Upon achievement of 95% of the first reference point acceleration, the vibration test is started. Vibration tests can be stopped by “Stop” key or by “Ctrl+space” combination. “Pause” key allows suspending vibration tests until the next activation of “Pause” key.
Right bottom part of the window has “Renew tests after suspension” option. Its activation allows renewing tests performance in 60 seconds after unexpected suspension of vibration tests (due to control parameter value non-conformance or transmission coefficient exceeding, etc.). The program smoothly increases stop frequency up to the necessary level and renews test as well as timing. In order to stop test performance in manual mode, make sure that the option is unchecked and click “Stop” key.
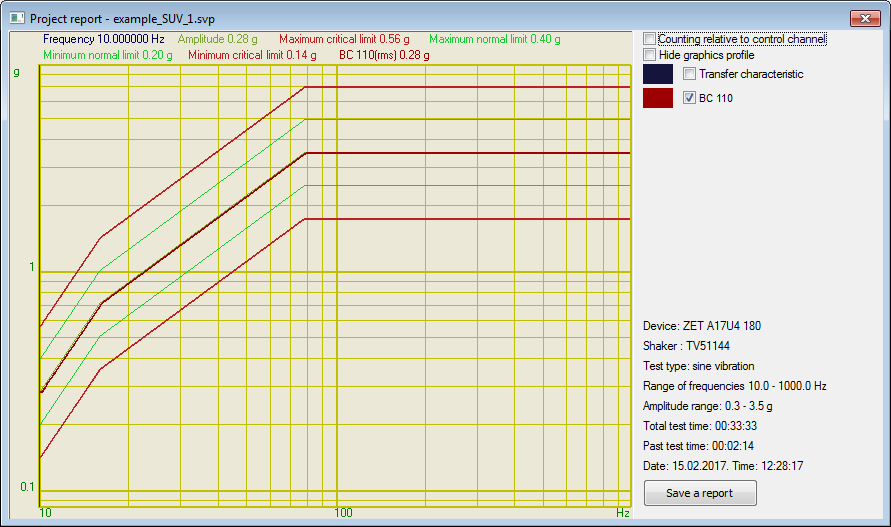
In order to activate vibration tests report window during or upon completion of vibration tests performance click “Report” key (left bottom part of the window).

Right upper part of the window depicts the diagrams that are available for preview (transmission function of vibration and vibration sensors diagrams selected for the control). The chart color can be changed by means of color icon located under the diagram title. Lower upper part of the window depicts vibration tests information: device name and type, shaker name, test type, frequency, and amplitude range, test time, total time, current date and time. Under the reference information section, there is an option “Save report“. It activates a dialog box allowing to save the selected diagrams as “dtn” file (transmission function will not be saved) or as “rtf” file. The saved files can be viewed by means of “Results view” program and can also be printed or saved in a text editor.
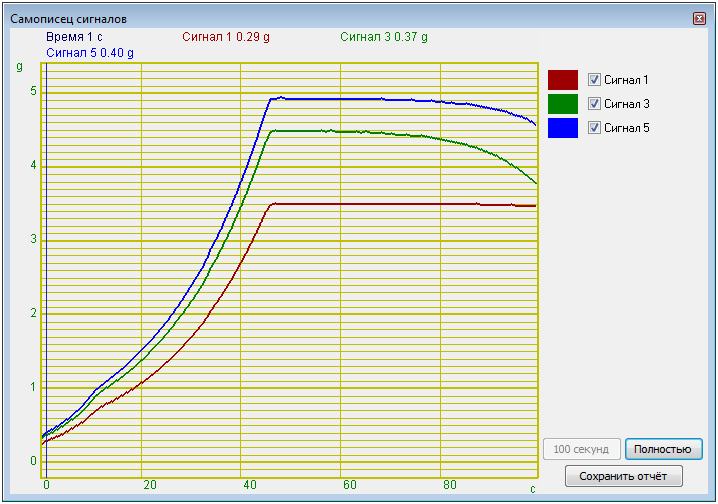
The low left part of the window also contains the icon “Signals recorder”. It activates signals recorder window depicting information of the vibration tests performed within a certain period.

Upper right part of the window depicts channels names with corresponding diagrams. Diagram color can be changed by clicking on the color block. The recorder can depict signal diagrams for the previous 100 sec or for the entire previous period. The choice of the mode is performed by clicking “100 sec” or “total” icon. The data of the recorder can be saved to the disk by choosing “Save report” option. The report is saved in “dtn” format which can be viewed by “Results view” program. The results can also be saved in “rtf” format to be viewed in text editing program. Only selected channels are shown in the report.
Vibration tests: additional information
Additional information regarding vibration tests, vibration shaker and VCS selection, equipment configuration, ZETLAB VIBRO Software functions, FAQ is represented in the Clause Vibration controllers – integration.
In the Clause Video lessons you can find detailed instructions on vibration test performance and preparation.
