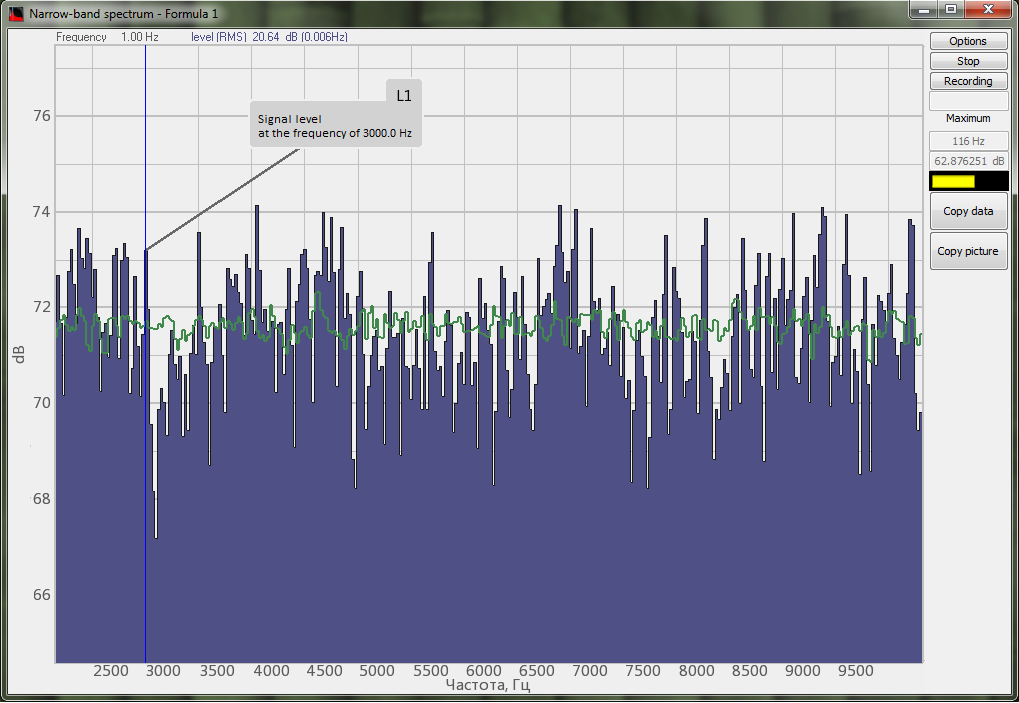
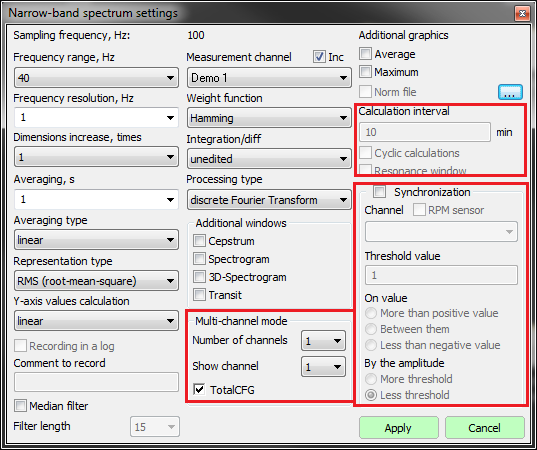
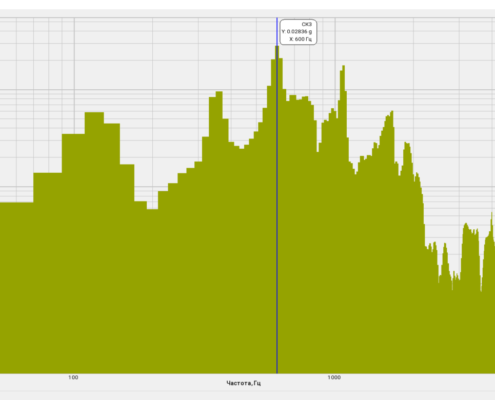
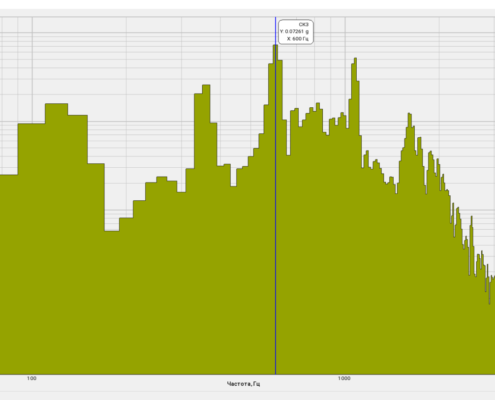
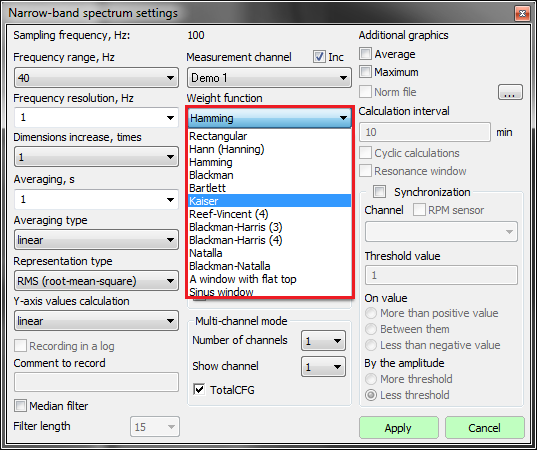
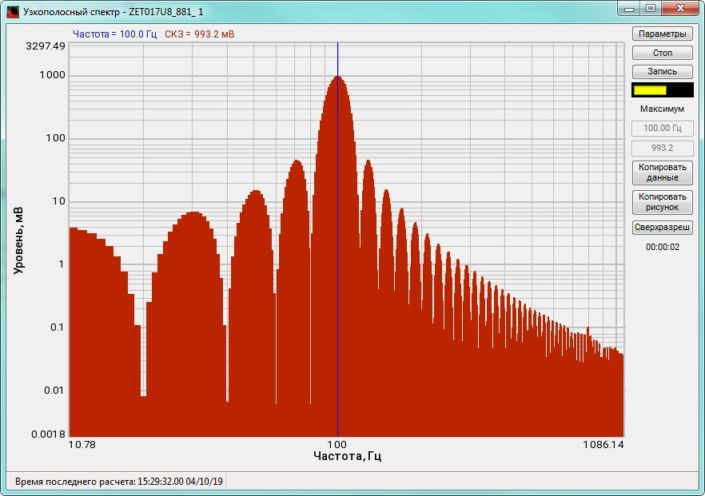
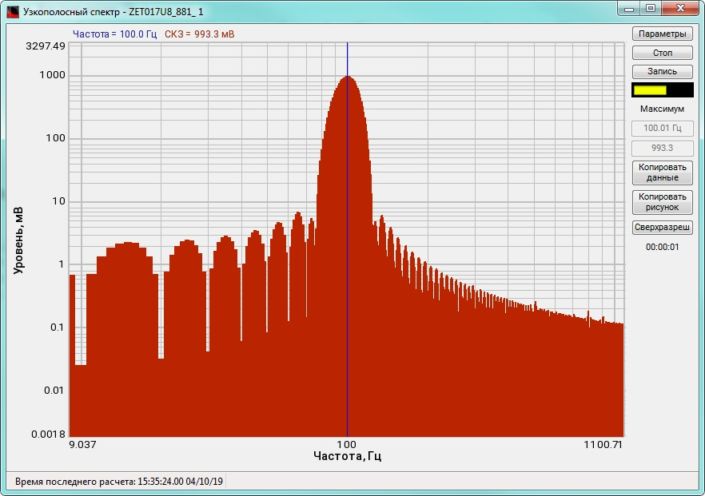
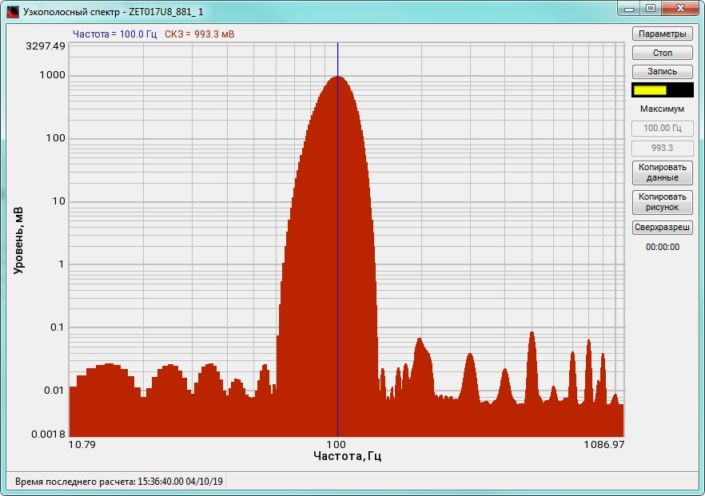
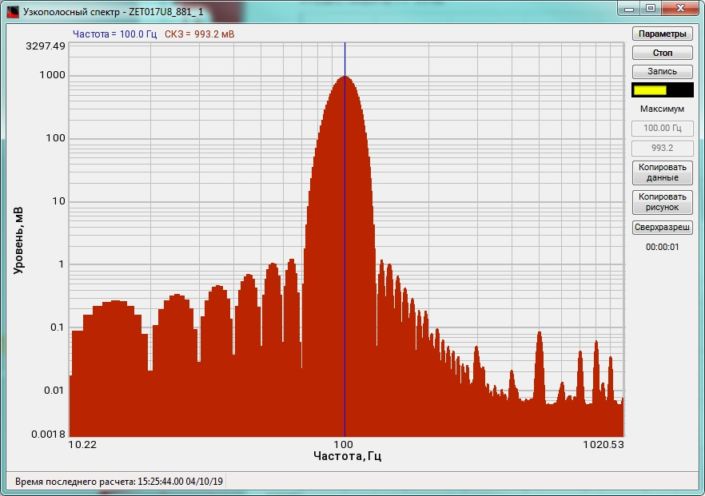
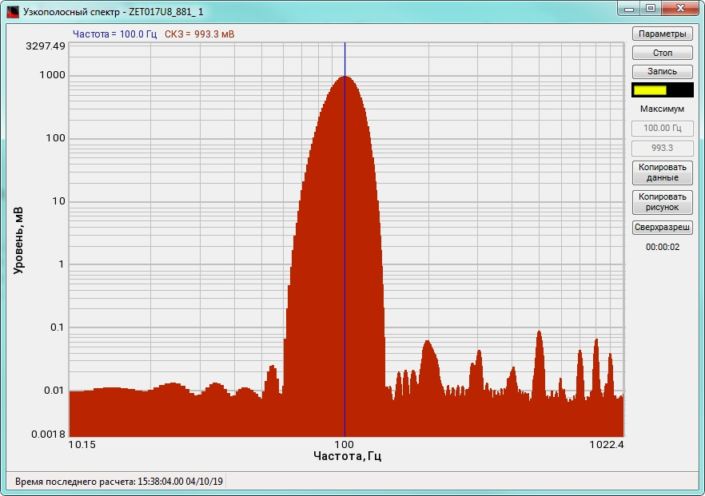
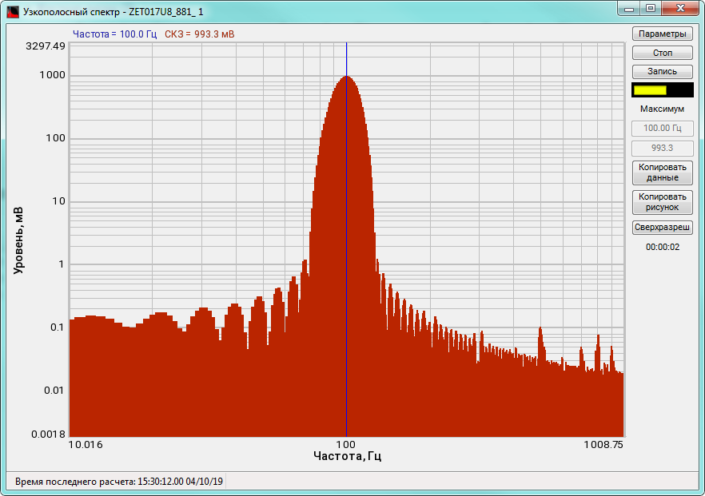
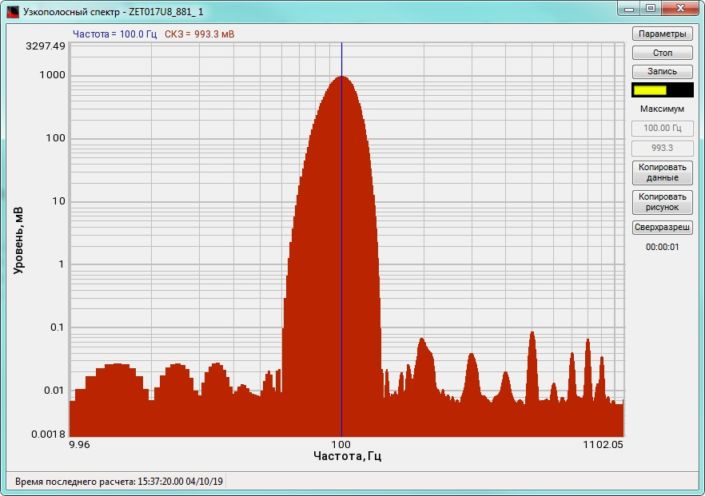
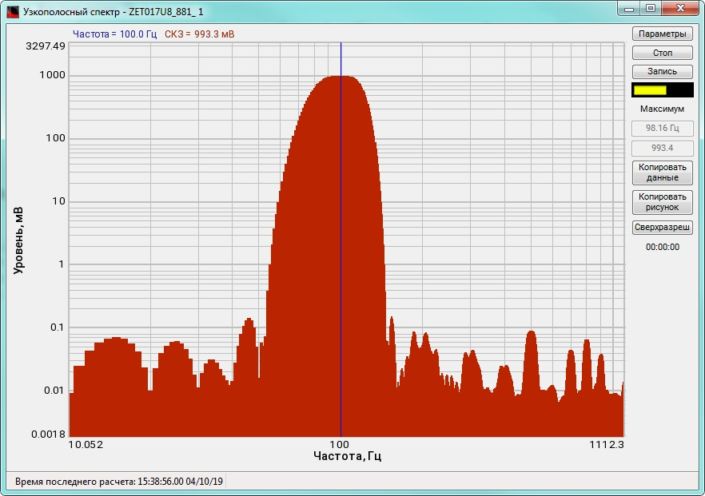
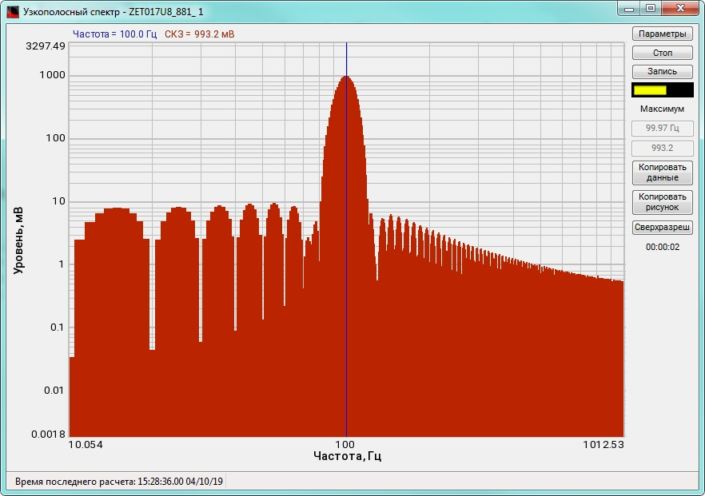
The possibility to obtain the maximum and averaged spectra values and to compare them with their pre-set spectra (norm) enables evaluation of the difference between the pre-set and actual spectrum level. This option is necessary for various types of equipment monitoring, input/output control.
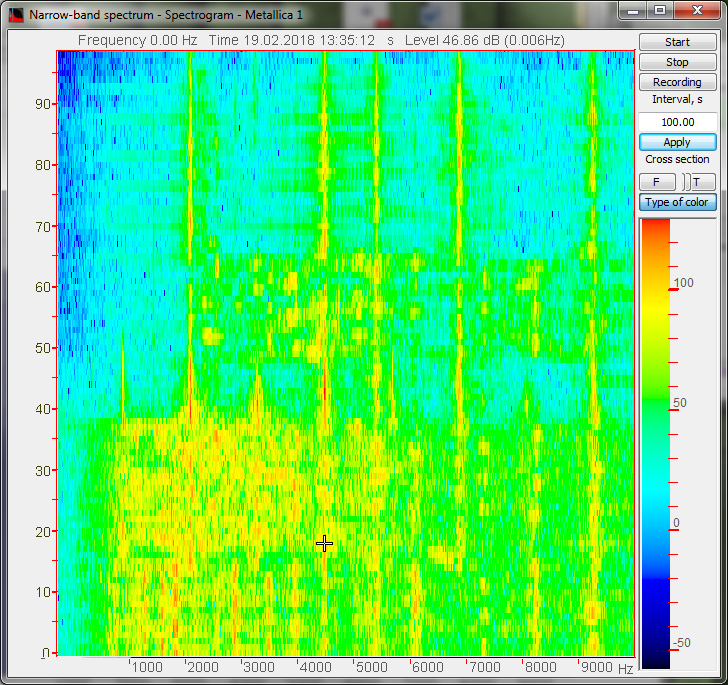
Simultaneous spectral analysis in various frequency bands of one and the same signal allows to observe the spectrum both in the entire frequency band (panoramic mode) and a detailed spectral analysis in the selected frequency bands. It is necessary if the signal has several high or low-frequency discrete constituents.
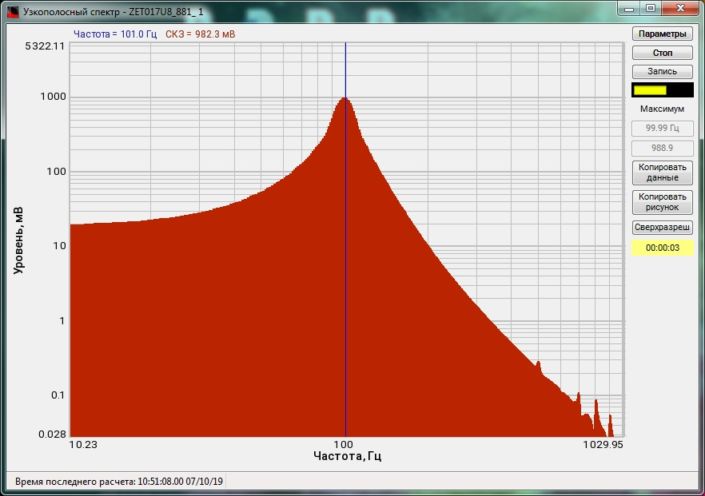
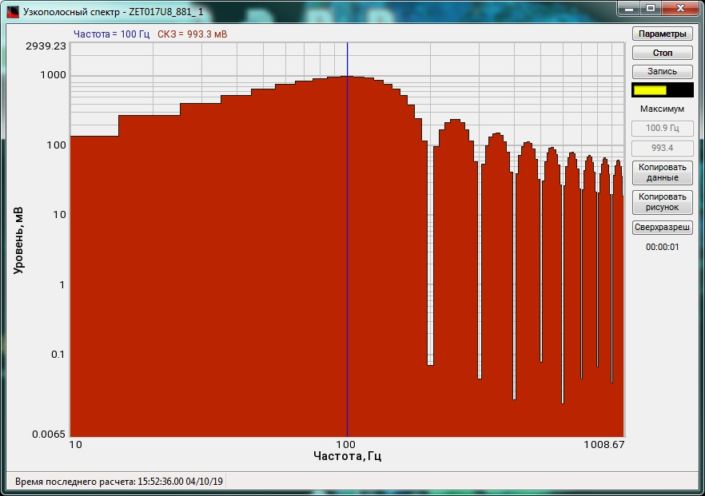
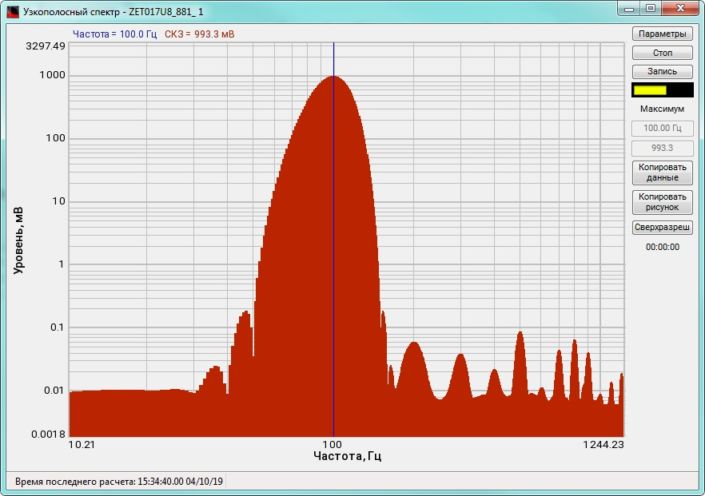
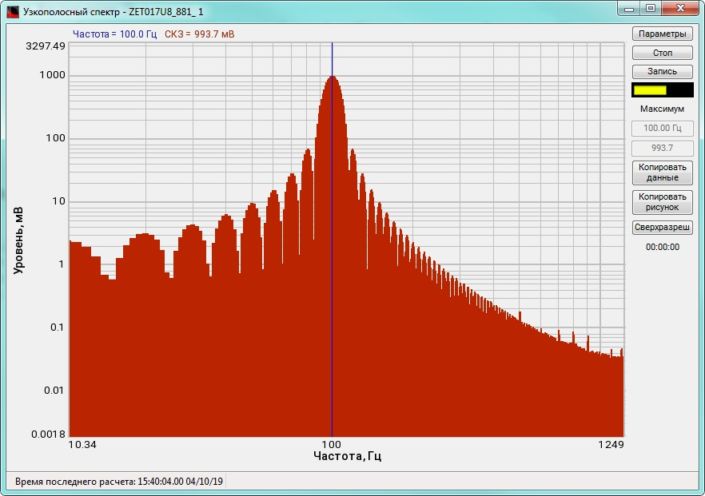
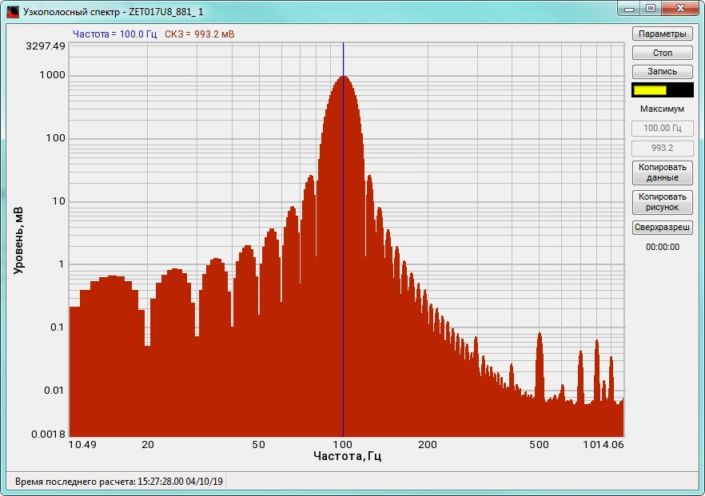
High-frequency resolution (up to 32,000 bands) allows to accurately determine the frequency of a stationary signal tone and to divide several adjacent frequency components. Such situation often occurs during vibroacoustic analysis of various mechanisms with electric drive. In the range about 50 Hz, several discrete constituents are typically determined, which are related to the electromagnetic blast, mechanical oscillations caused by the rotation of an asynchronous engine. All of these sources are typically located in a band of up to 0.5 Hz.
When analyzing noise components, discrete constituents on the spectrum could be quite disturbing. The program provides an option Clearing spectrum from discrete constituents (DC). This function suppresses all stationary signal tones.
Piezoelectric accelerometers are usually used for vibroacoustic analysis. These sensors send a signal proportional to the acceleration at the attachment point. Norms for vibration levels and their spectral composition are usually determined by the vibrational velocity value. To obtain a vibrational velocity signal, it is necessary to integrate the vibrational acceleration signal based on the time. For balancing, it is necessary to obtain the vibrational displacement value at the sensor attachment point. A vibrational signal time-based double integral allows for obtaining a vibrational displacement signal. These additional signal integration and differentiation functions are available in the described program.
For measuring the discrete constituents level, the root-mean-square (RMS) is usually measured in the filter band. In this case, the level of the discrete constituent does not really change against the analysis band. For measuring the level of noise components, it is necessary to measure the spectral power density (SPD) which is set in unit of measurement/√Hz. This is necessary because the noise spectral power density does not depend on the analysis band. FFT Analysis allows to calculate the spectra based on RMS, SPD, and amplitude values.

