ZETLAB MASW
Data processing using the multi-channel analysis of surface waves method (MASW)
The multichannel analysis of surface waves is performed in two stages. At the first stage, measurements are performed with excitation in several points and saving the measured data to Seg-y files; at the second stage, the saved data are processed with the MASW method in the RadExPro software according to the manual //radexpro.ru/site/files/tutorials/RU_MASW_tutorial_rev120515.pdf.
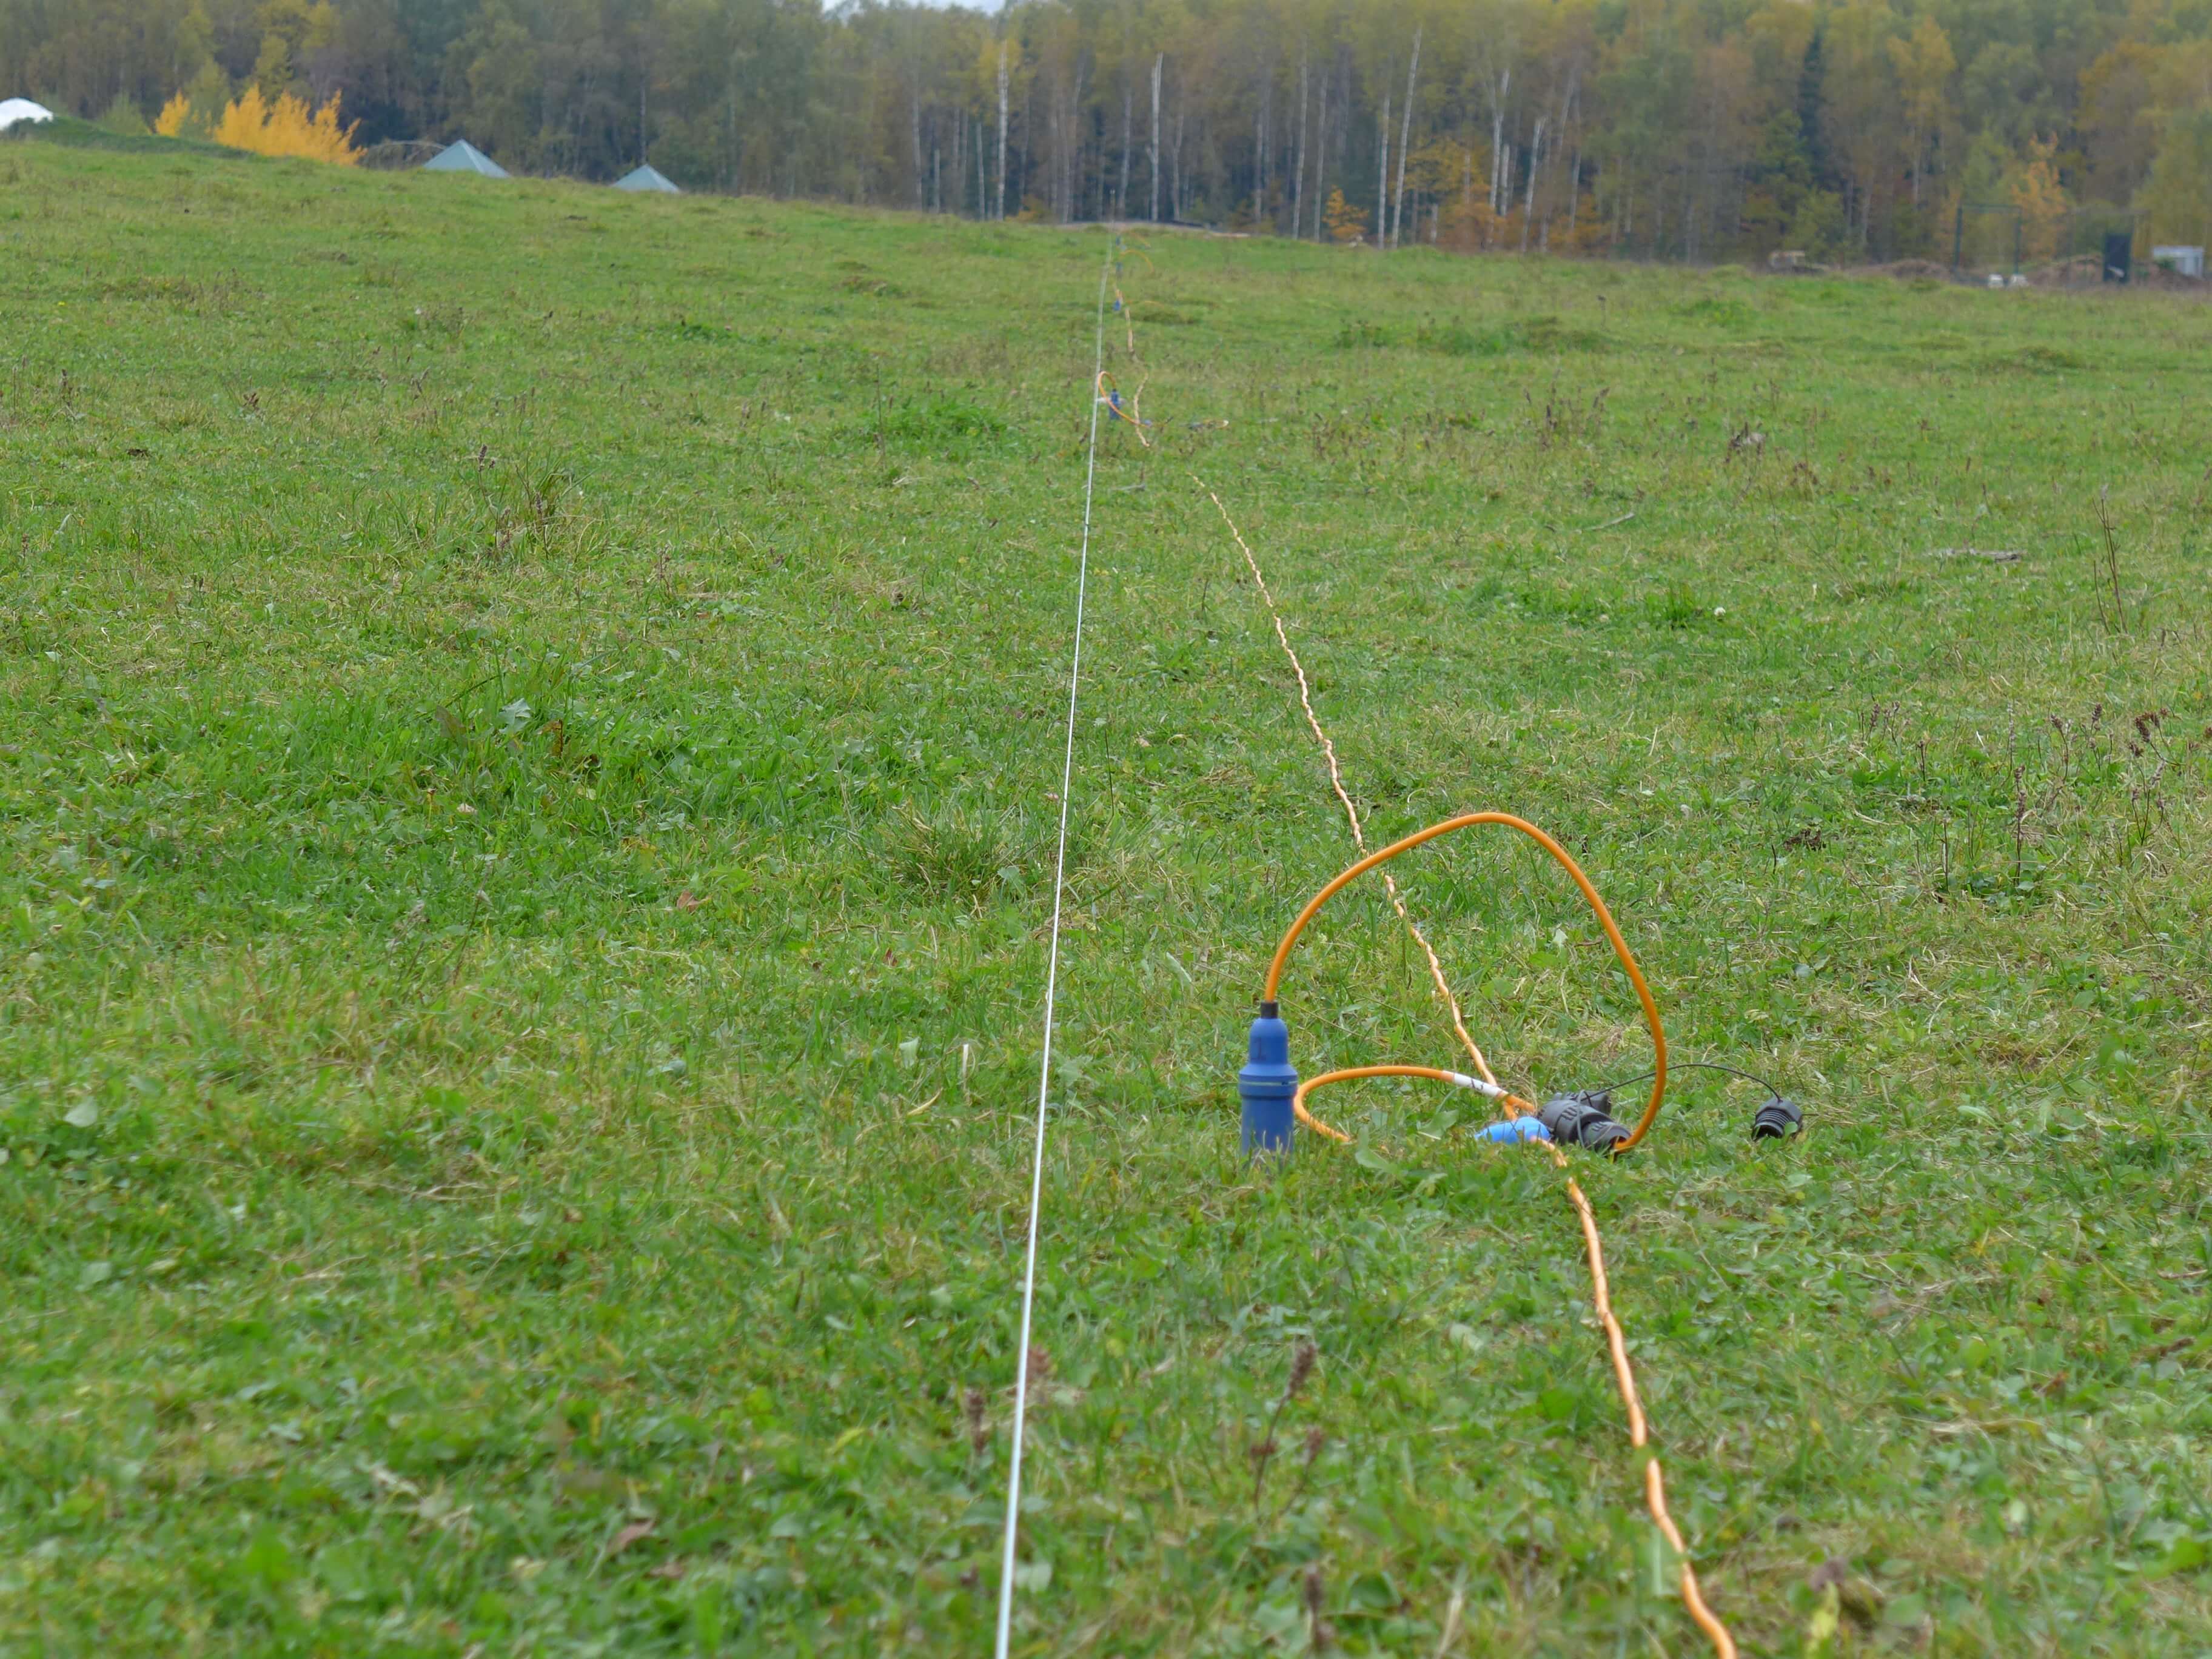
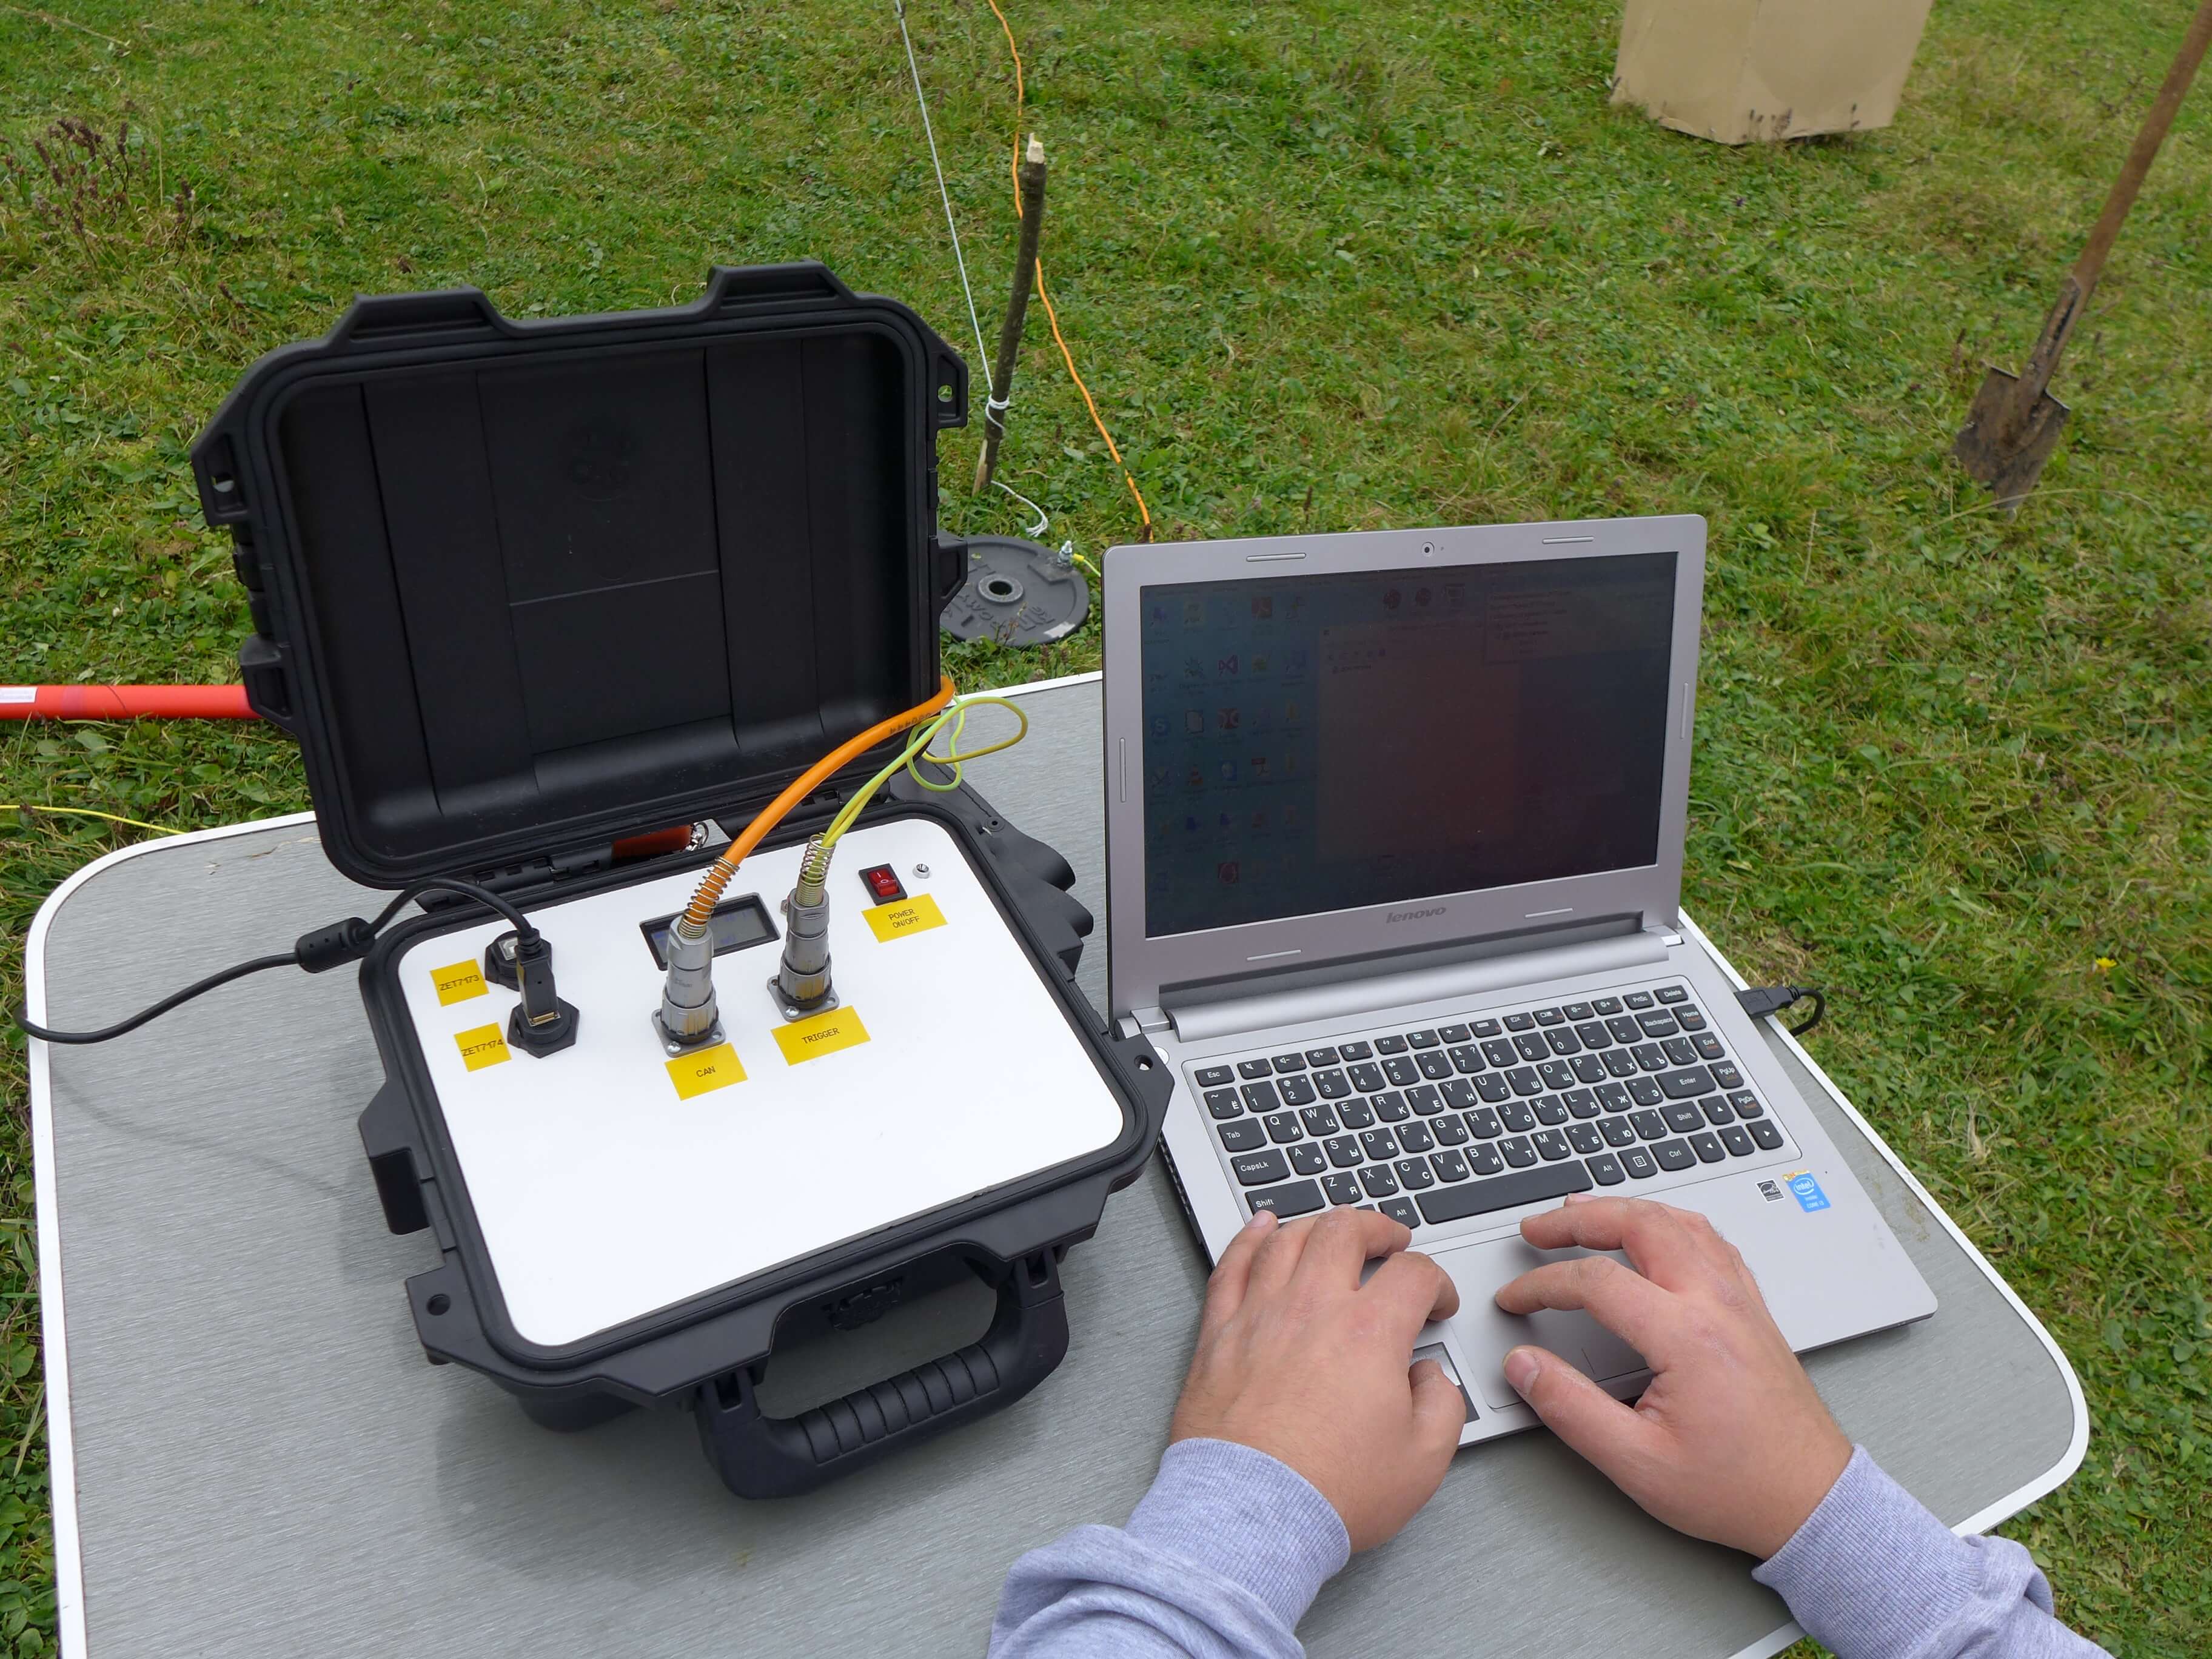
The measurements are performed using a digital multi-channel seismic cable. All stethoscopes within the seismic cable are synchronized based on the navigation satellites’ signals using the ZET 7175 Synchronization Unit which is a part of the mobile measuring system. For measurements, the standalone signal recording mode is used, as implemented by the ZET 7173 Standalone Recorder.
When an excitation is caused by the impact hammer, the event is detected by ZET 7160 Logical Analyzer included in the mobile system; at that, the recorder registers the electric front of the digital signal and records this event in its internal log.
After the impact, ZETSENSOR mobile system is connected to a PC to transmit the recorded data for subsequent processing. Prior to the data uploading, files with the sampling rate over the recorded one (the data has been recorded with 200 Hz sampling rate, and those need to be re-sampled to 8 kHz rate, for instance) need conversion. Data conversion and transmission is performed using the ZETLAB software.
Transmitted data can be viewed using the historical data viewer (Figure 1).
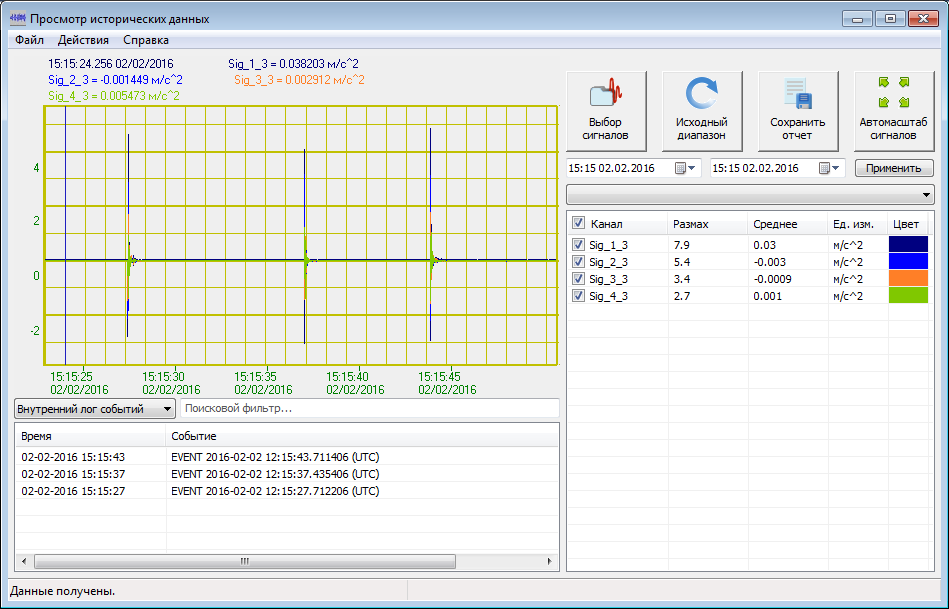
Figure 1 “Historical data viewer” program
The event window displays the events corresponding to the surface wave excitation moments. Using zoom, mark a required fragment of the record (Figure 2).
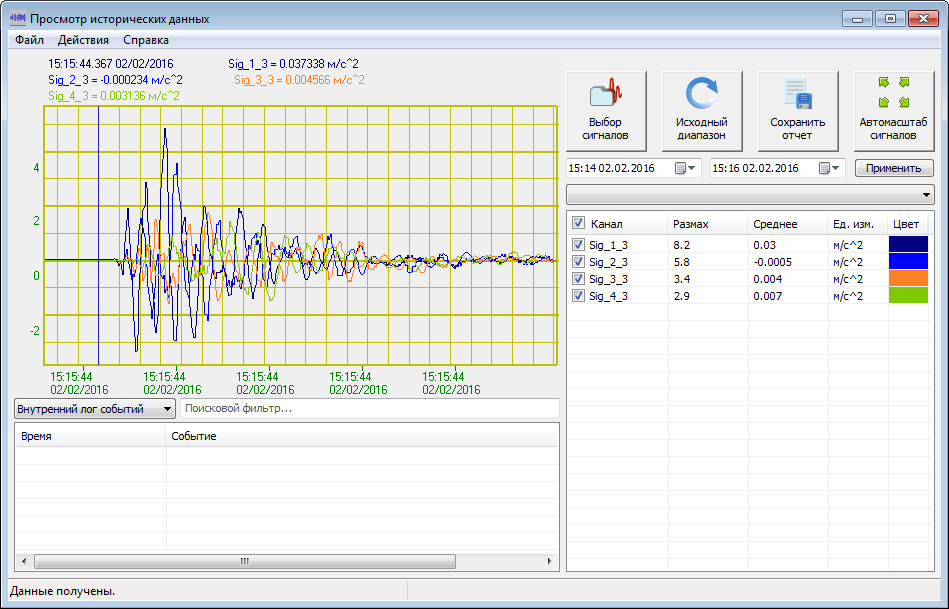
Figure 2 “Historical data viewer” program
For subsequent processing, save the data in the Seg-Y format using File menu, then press Save… (Figure 3).
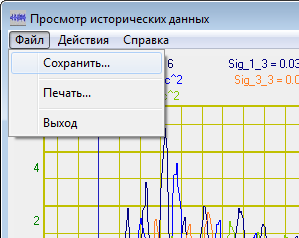
Figure 3 Saving a Seg-Y file
Further processing is performed in the RadExPro program according to the manual, //radexpro.ru/site/files/tutorials/RU_MASW_tutorial_rev120515.pdf. Data from Seg-Y is used as the input data.
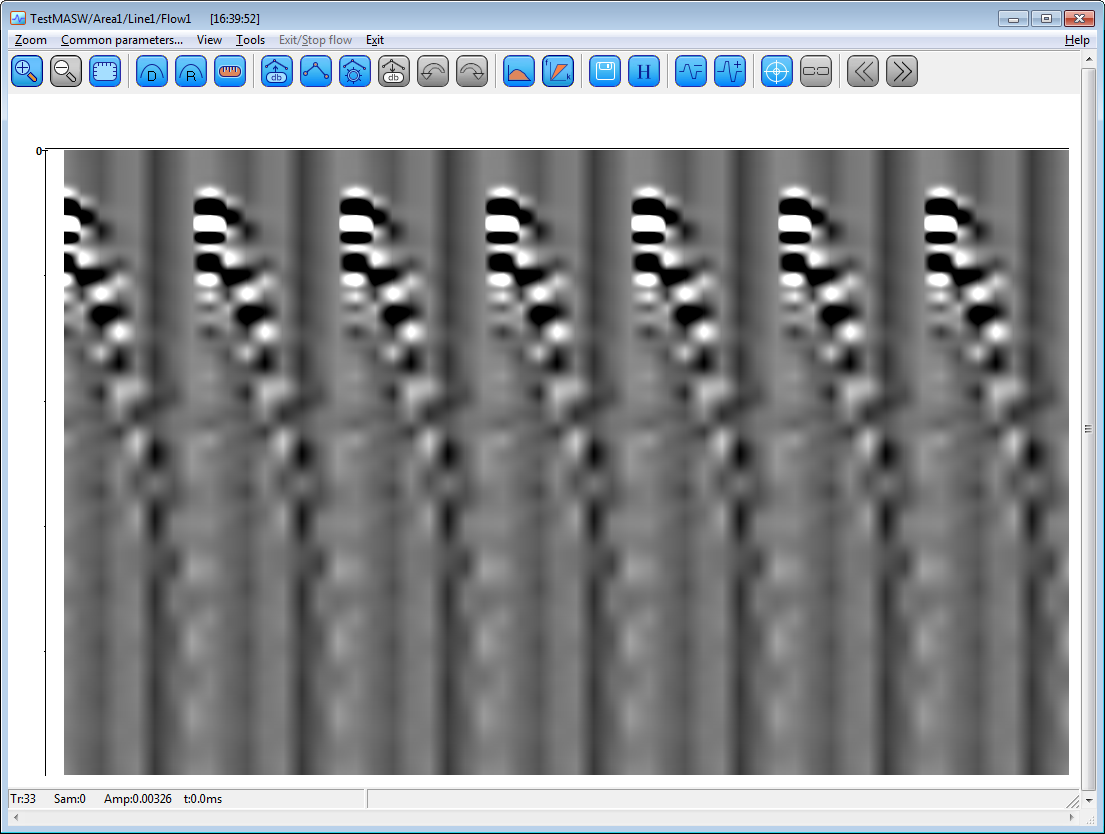
Figure 4 Surface waves displayed in the Screen Display window
As a result, dispersion image is calculated for the set of data (Figure 5).
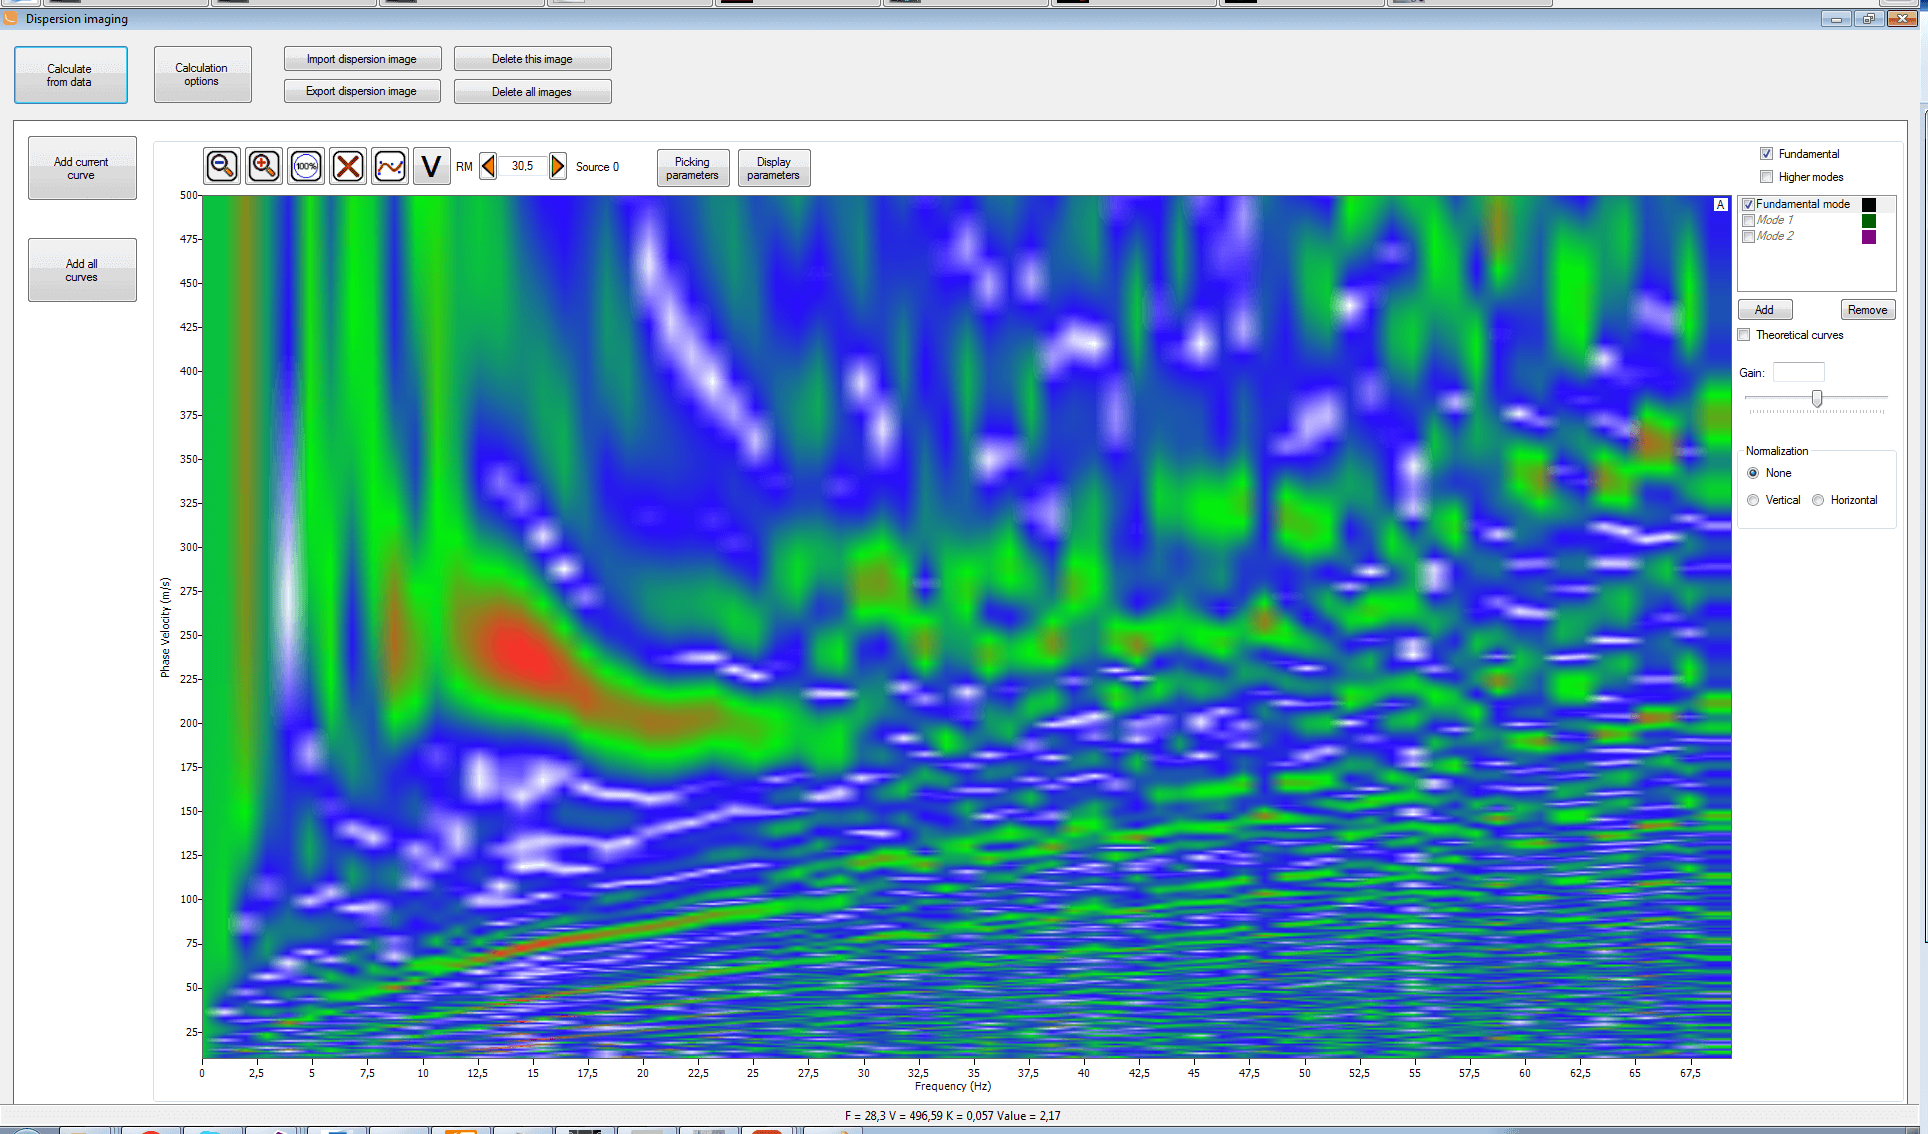
Figure 5. Dispersion image
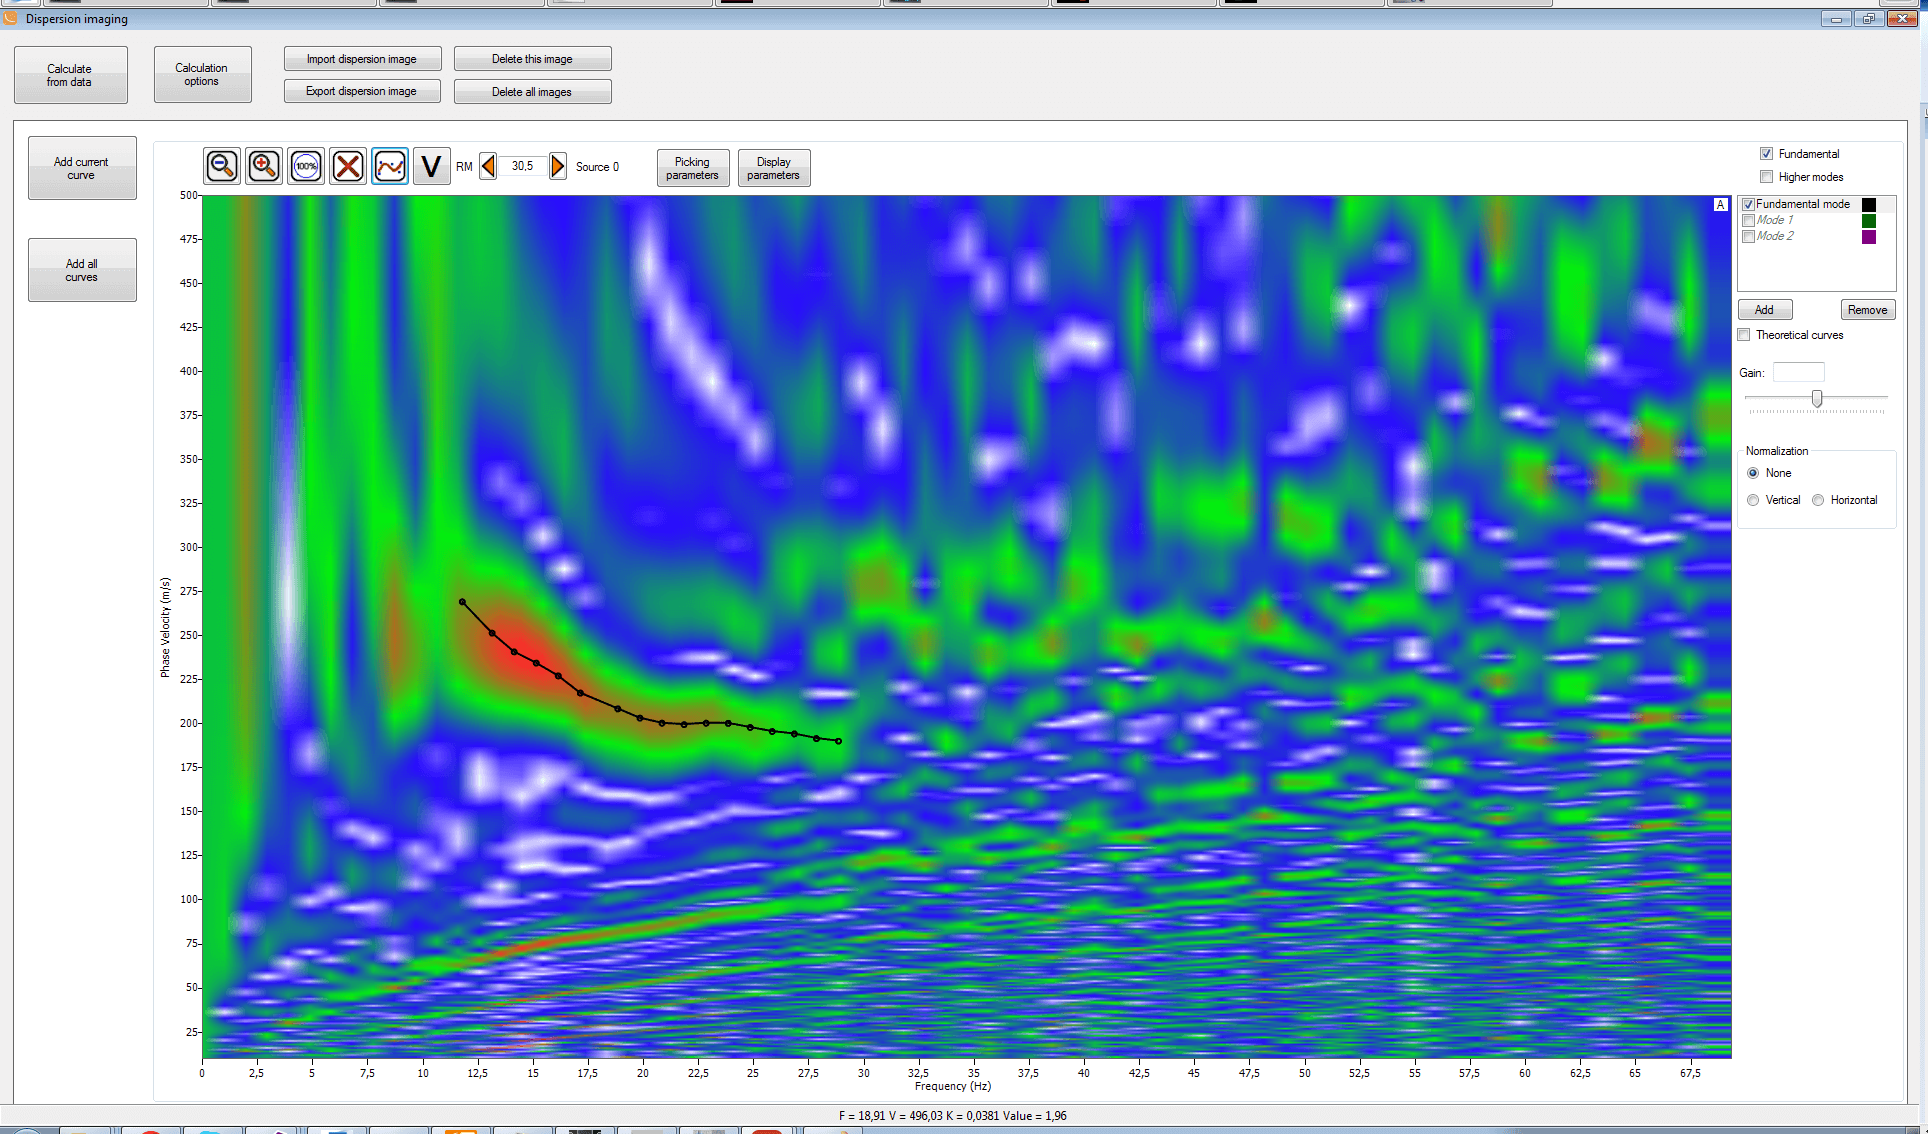
Figure 6. Mode selection on the dispersion image
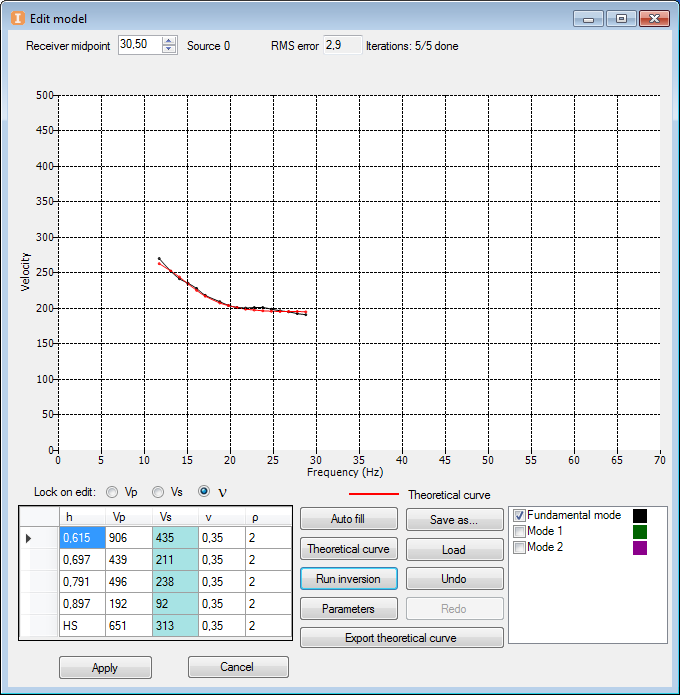
Figure 7. Curve selection window
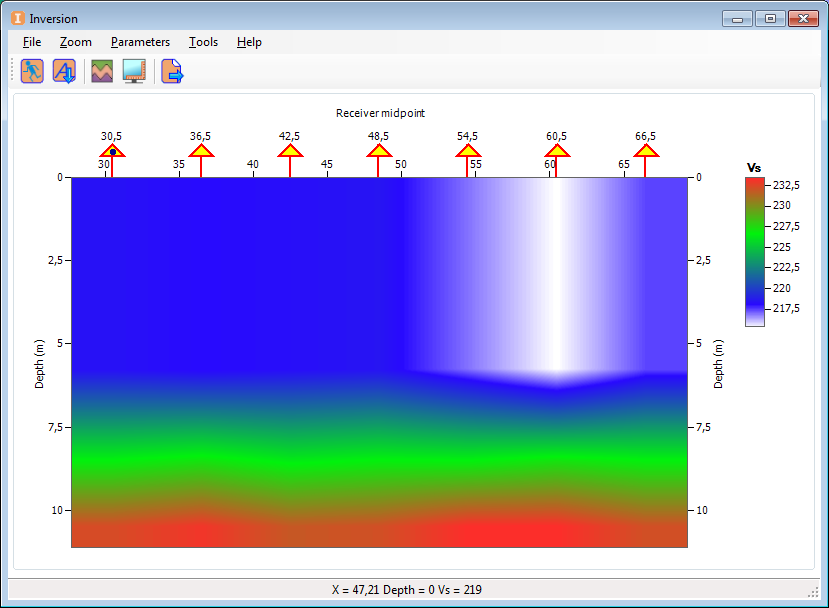
Figure 8. Initial model image
DETAILED INSTRUCTION
can be found in the Video lessons section and on our YouTube channel Zetlab Public.

