Automation of Parameters Measurement
For Vibration Measuring Transducers
To eliminate a human factor and to reduce the time costs during measurements, calibration of vibration-measuring transducers must be automated according to the methodological instructions (MI) 1873.
The essence of automation is a software control of devices according to a specified algorithm replicating actions of a calibration operator.
For this, connect generator and voltmeters to a computer through the RS-232 interface or USB. Hardware is operated via virtual devices. The control algorithm is implemented in SCADA (Supervisory Control and Data Acquisition) system.
In this case, the calibration scheme is shown below:
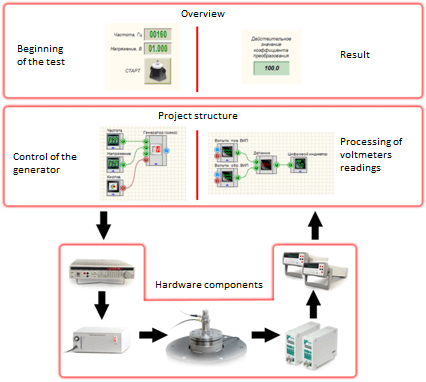
Automated calibration scheme
The SCADA systems allow creating flexible applications from complete functional units such as virtual measuring instruments, mathematical processing components, charts, and indicators etc.
Project created in SCADA consists of 2 parts:
- A flowchart which directly implements an operation algorithm;
- Interface
Main process nodes of the vibration transducers calibration project flowchart:
- generator and voltmeter control;
- algorithms of calibration and measurement control;
- processing results;
- generating a calibration report.
Calibration of any parameter has the same structure and consists of the following actions:
- Defining the calibration parameters, as well as setting to zero the previous results;
- Measurements: choosing frequency and amplitude – tuning the generator voltage – collecting voltmeter indications
- Processing the measurement results and displaying the calibration results
Functional units of a visual part of the project ensure:
- setting parameters and starting calibration by an operator;
- output of measurement results in graphical and numerical form.
Defining a Valid Conversion Coefficient Ratio
Calibration operator’s actions: specify basic values of frequency and vibration acceleration amplitude in accordance with sensor datasheet.
Project operation: a configured vibration acceleration amplitude is reproduced during the process of measuring at the specified frequency and the conversion ratio of the calibrated vibration transducer is determined by the following formula:
![]()
where:
Кд – a valid conversion coefficient value, mV/ms-2;
Uδ – an electronic voltmeter indications at the basic frequency, mV;
aд – a valid vibration acceleration value reproduced by a vibration board (determined based on the reference accelerometer indications), m/s 2;
γСУ– a conversion coefficient of a matching amplifier (γСУ=1, if the matching amplifier is not available).
Examples of operating the “Calibrating of vibration transducers” project implemented in SCADA system ZETView are shown below. The valid conversion coefficient value is defined on the main page of the project. Parameters specified by operator (reference frequency and basic amplitude) are also used during measurements in the amplitude and frequency range. The “Current values” tab shows indications for channels of the reference sensor and sensor under calibration, as well as oscillograms of their signals.
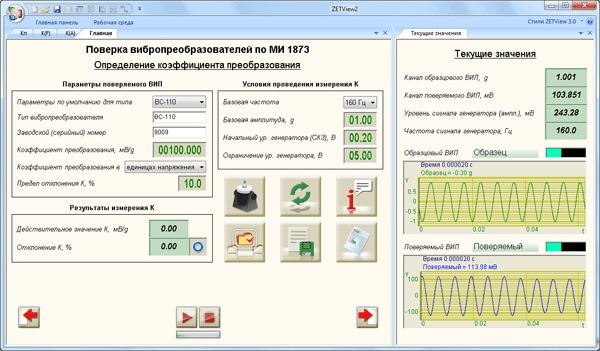
Defining a valid conversion coefficient value
All the calculations are made automatically. Results are compared with tolerances, and calibration results are displayed on the screen: a valid conversion coefficient value and its deviation from the sensor’s datasheet value.
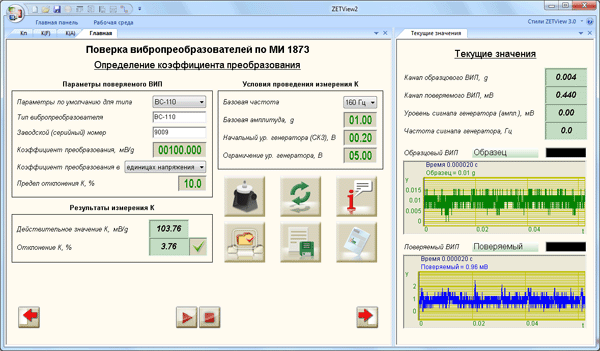
Display of K measurement results
Сalibration operator’s actions: specify the start value and end value of the vibration acceleration amplitude range and the number of measurement points, as well as the basic frequency value.
Project operation: measurement range is divided into a specified number of points with creating an array of vibration acceleration amplitude values. During the measuring process, all the vibration acceleration amplitude values are reproduced sequentially at basic frequency and voltmeters indications are recorded. At the same time, a graph of dependence of the conversion coefficient on vibration acceleration amplitude is created. After the measuring, the results are processed.
Non-linearity of amplitude characteristic (δа) in percent is calculated by formula:
![]()
where:
Ki – conversion ratio with i-value of vibration acceleration, mV/ms-2;
Kav – average conversion ratio in the entire vibration acceleration amplitude range:

where n is the number of measurement cycles.
Examples of operating the “Calibrating of vibration transducers” project implemented in SCADA system ZETView are shown below. The “К(а)” tab defines the test parameters and shows the graphs of the dependence of conversion ratio of the calibrated sensor on vibration acceleration amplitude (during measurements) and conversion coefficient deviation from vibration acceleration amplitude (after completion of measurements). The “Current values” tab shows the indications for channels of the reference sensor and sensor under calibration, as well as the oscillograms of their signals.
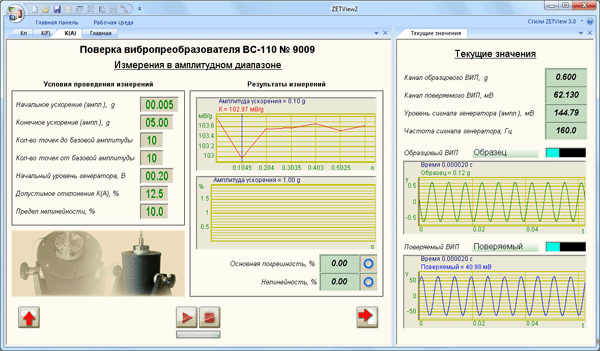
Measurements in the amplitude range
All the calculations are made automatically. The results are compared with tolerances, and the calibration results are displayed on the screen in graphical, numerical and indicator view.
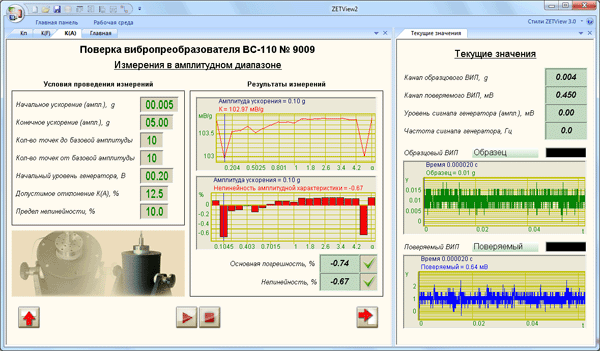
Display of K(a) measurement results
Measurements in the Frequency Range
Operator`s actions: specify the start and end value of the frequency range, the basic vibration acceleration amplitude value in accordance with the datasheet for the sensor, as well as the vibration relocation value limit at low frequencies in accordance with characteristics of the vibration board.
Frequencies are selected from the 1/3 octave series: 1; 1.25; 1.6; 2.0; 2.5; 3.1; 4.0; 5.0; 6.3; 8.0; 10.0; 12.5; 16; 20; 25; 31; 40; 50; 63; 80; 100; 125; 160; 200; 250; 315; 400; 500; 630; 800; 1000; 1250; 1600; 2000; 2500; 3150; 4000; 5000; 6300; 8000; 10,000; 12,500; 16,000; 20,000 Hz. [3]
Project operation: During measurements, depending on frequency the vibration acceleration amplitude value is specified and fluctuations with specified parameters are reproduced. The voltmeters indications are recorded for each frequency. At the same time, a graph of dependence of the conversion ratio on vibration acceleration amplitude is created. After the measuring, the results are processed.
At all frequencies above 20 Hz, the vibration acceleration is reproduced with amplitude equal to a basic value. At low frequencies, the amplitude of vibration acceleration A is calculated to ensure that relocation of the vibration table does not exceed a maximum acceptable value of S. The dependence of vibration acceleration on frequency and vibration relocation is described by formula:
![]()
where:
A – vibration acceleration amplitude, m/s2;
f – oscillation frequency, Hz;
S – vibration relocation, mm.
The bandpass flatness of the vibration transducer (γ) in percent is calculated by formula:
![]()
where:
Kn – maximum or minimum conversion coefficient of the vibration transducer that is being calibrated in the frequency range, mV/ms-2;
Cb – conversion coefficient of the calibrated vibration transducer, which is defined at basic frequency, mV/ms-2.
Examples of operating the “Calibrating of vibration transducers” project implemented in SCADA system ZETView are shown below. The “К(f)” tab defines the test parameters and shows the graphs of the dependence of the conversion coefficient of the sensor under calibration on frequency (during measurements) and the conversion coefficient deviation from frequency (after completion of measurements). The “Current values” tab shows the indications for channels of the reference sensor and calibrated sensor, as well as the oscillograms of their signals.
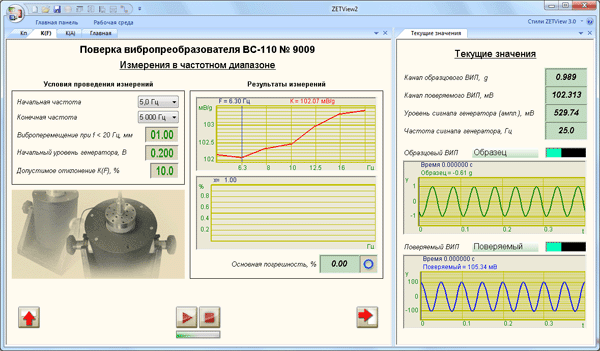
Measurements in the frequency range
All the calculations are made automatically. The results are compared with tolerances and calibration results are displayed on the screen in graphical, numerical and indicator view.
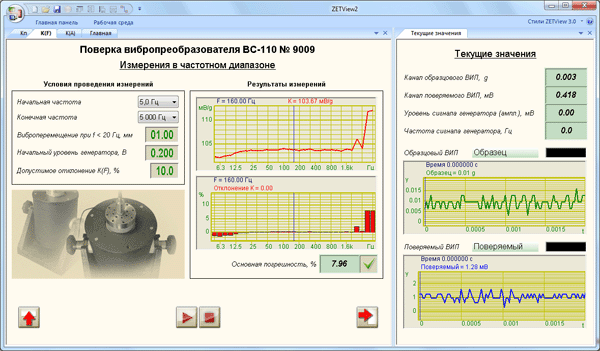
Display of K(f) measurement results
- Implementing Generator Feedback During the vibration transducers calibration, frequency and amplitude value of acceleration reproduced by the vibration board are specified as test parameters. The generator’s signal voltage which ensures a specified vibration acceleration amplitude depends on signal frequency, as well as power amplifier settings. Therefore, during the measurements it is necessary to adjust the output signal voltage of the generator.The output signal voltage of the generator is adjusted as follows:
- On the generator output a signal with specified frequency and random voltage value is set;
- The current value of vibration acceleration amplitude is defined based on the reference sensor amplitude;
3. A level of the generator providing a necessary Unew value of vibration acceleration amplitude is calculated by formula:
![]()
where:
Unew – new voltage value of the generator, V;
k – generator voltage correction coefficient:
![]()
where:
Азад – a specified value of vibration acceleration amplitude, m/s2;
Aтек – current value of vibration acceleration amplitude, m/s2;
U0 – initial voltage of the generator, V.
Automatic Selection of Data Storage Time
In attempt to reduce the calibration time and measurement optimization time, the project development usually requires automatic selection data storage time, in which case, two factors are taken into consideration: data averaging interval by voltmeters and the delay before voltmeters indications recording.
The data averaging interval by voltmeters must cover at least 5 signal periods to ensure the convergence of indications and reduce interference on the indications. The graphs in the figures below show dependence of the voltmeter indications on averaging time equal to two signal periods (a) and ten signal periods (b).
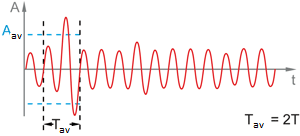
Effect of signal averaging time on voltmeters indications (averaging in 2 periods)
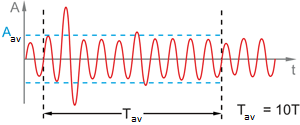
Effect of signal averaging time on voltmeters indications (averaging in 10 periods)
Aav – an average signal amplitude, Tav – averaging time, T – signal period
Timeout before recording o voltmeters indications must exceed data averaging interval by voltmeters in order to make sure that the recorded value and data collected by voltmeters before change of frequency/amplitude is not affected by transient processes. Voltmeter response time depends on signal frequency (see figures below).
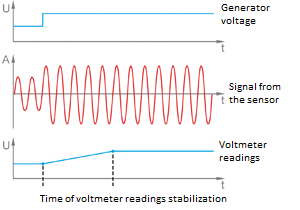
Stabilization time of voltmeter readings for high frequency signals
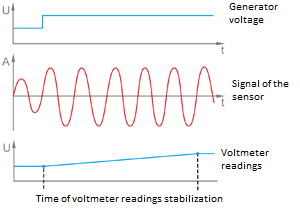
Stabilization time of voltmeter indications for low frequency signals
To estimate reduction of time costs when using the algorithm of automatic selection of data storage time, we will calculate time of measurements in the frequency range from 1 to 20 kHz in increments of 1/3 octave. During calculations, we will take into account that the measurements are made in 2 stages:
- Recording of voltmeter indications according to the reference sensor to determine the generator voltage correction coefficient;
- Recording of voltmeter indications to determine the conversion coefficient of a calibrated sensor.
When the averaging interval is set to 10 signal periods and timeout is set to two averaging intervals, the measurements without automatic selection of data storage time takes around half an hour:
| Frequency range, Hz | Number of points | Period duration, s | Data averaging interval by voltmeters, s | Timeout, s | Measurement time at one point, s |
| f | N | T=1/f | Tav=10·max(T) | Texp=2·Tav | Tmeas=2·Texp |
| 1 – 20,000 | 46 | 0.00005 – 1 | 10 | 20 | 40 |
| Duration of measurements: 46·40=1,840 seconds ≈ 30 minutes | |||||
When frequency range is divided into subranges, the calibration duration time is reduced to 9 minutes:
| Frequency range, Hz | Number of points | Period duration, s | Data averaging interval by voltmeters, s | Timeout, s | |
| f | N | T=1/f | Tav=10·max(T) | Texp=2·Tav | Tmeas=2·Texp |
| 1 – 10 | 11 | 0.1 – 1 | 10 | 20 | 40 |
| 10 – 100 | 11 | 0.01 – 0.1 | 1 | 2 | 4 |
| 100 – 20,000 | 24 | 0.00005 – 0.01 | 0.1 | 1 | 2 |
| Duration of measurements: 11·40+11·4+24·2=532 seconds ≈ 9 minutes | |||||
Processing Measurement Results
The mathematical component of SCADA systems is used to process measurements results strictly in accordance with the MI 1873 methodological instructions. The obtained parameter values are compared with tolerances and a sensor suitability conclusion is made.
A fragment of the “Calibrating vibration transducers” project’s internal structure from measurement channels to the result indicator is shown below:
Signals from the reference sensor and calibrated sensor are sent to AC voltmeters. The voltmeters indications are divided, and the obtained conversion coefficient of the calibrated sensor is sent to the K(F) array. During the measurements, the array of the conversion coefficient with all values from the selected frequency range is formed. Index of reference frequency of the selected range is determined by deducting the initial frequency index from the basic frequency index.
Based on the К(F) value array and reference frequency index, an array of the conversion coefficient deviations from the value at reference frequency is determined by consecutive operations “Calculation of constant”, “Division by constant”, “Multiplication by constant”. This array is displayed on a graph, and the module maximum value of an array element which is displayed by the digital indicator and compared to tolerance is determined. The result of comparison is shown on the indicator figure.

A fragment of the “Calibrating vibration sensors” project from measurement channels to calibration results
Saving Result
One more advantage of SCADA application is a possibility to save test reports by one click. The report files are generated based on user template, i.e. the measurement results can be recorded into the company’s form.
A template of test report is attached to the “Calibrating vibration transducers” project. This template can be changed according to requirements of a company which uses the project or has ordered the vibration sensors calibration. Sample report template and a test report sample created with this template are shown below (click on the image to zoom).
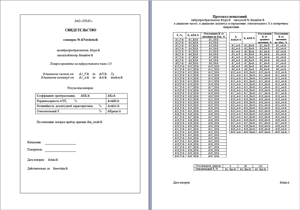
Vibration Sensor Calibration Report Template
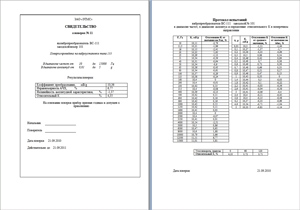
Vibration Sensor Calibration Report
