Historical events view
This program is included into basic ZETLAB software set and enables representation and analysis of historical events registered by means of ZETLAB sotware for a long-term time span.
“View historical events” program is available in the “Register” tab of ZETLAB panel.
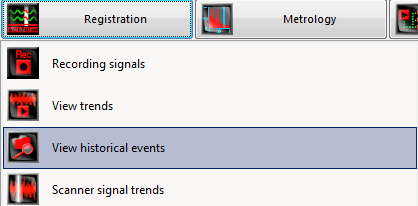
“Historical events view” has several sub-clauses:
- Quick access menu;
- A chart with selection of the recorded structures;
- Coordinates for graphical representation of the events.
Quick access menu
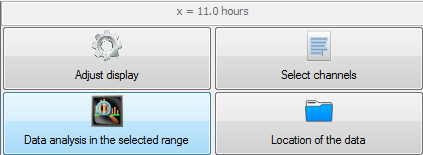
The menu contains a set of “hot keys” used for fast adjustment of “View historical events” program settings. In the figure below you can see the image of quick access menu.

Data location
The key “Data location” allows you to select the directory to be used for storage of the recorded data. There are three options available:
- Standard signals directory
- User directory
- Demo-server

Standard directory is set in the main menu of ZETPanel upon activation of the key “User configuration”.
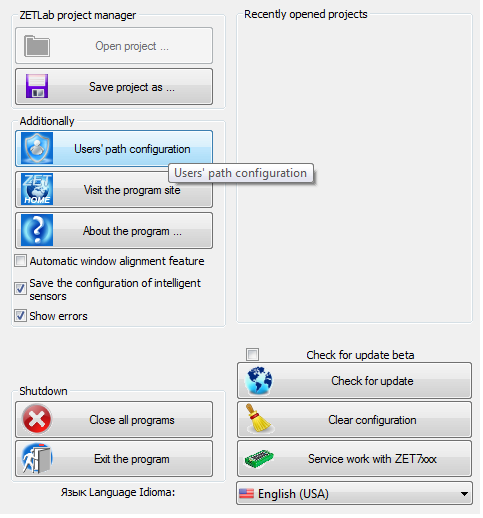
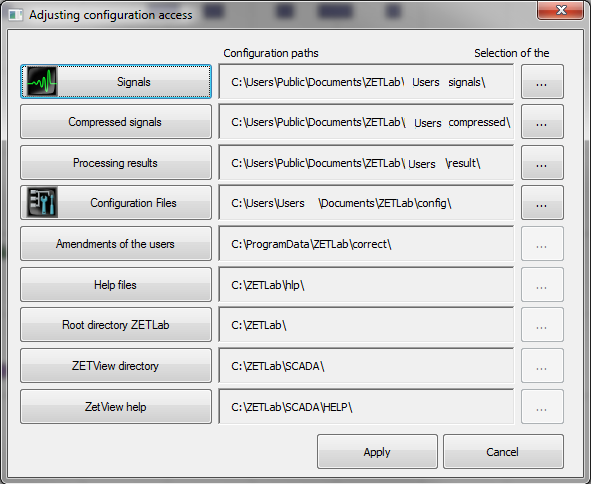
In the case if “DEMO-Server” directory is selected, the data will be downloaded from ZETLAB server (this data has been recorded in the Company’s headquarters).
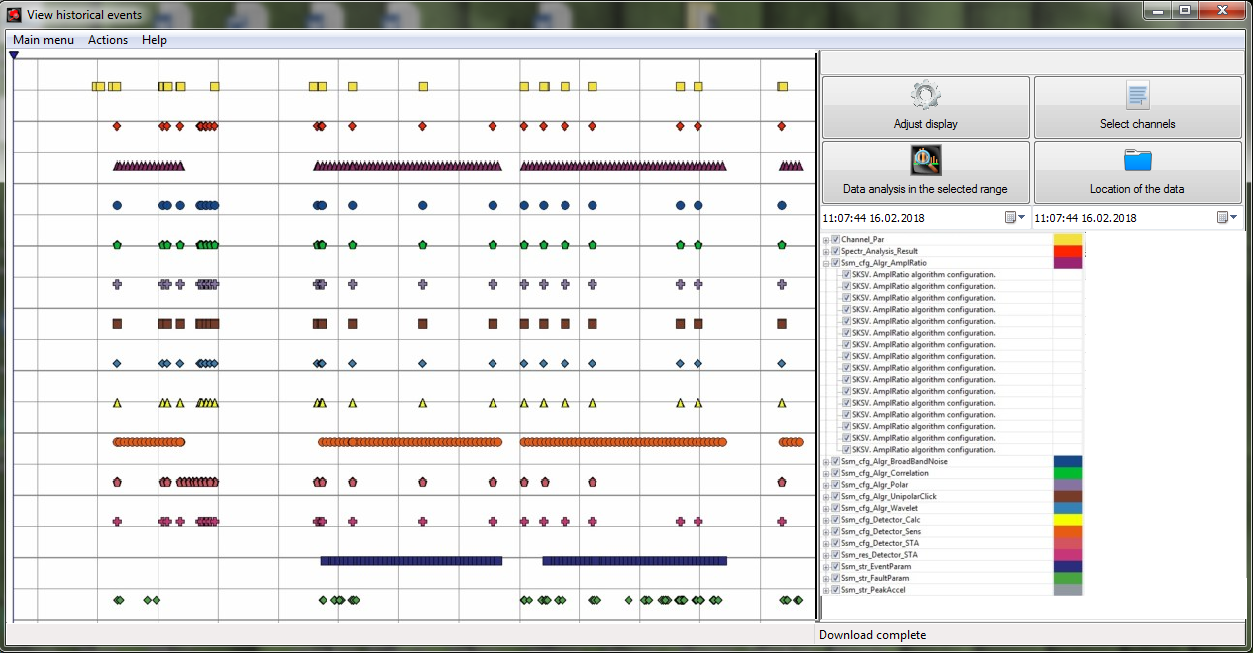
Upon selection of files directory there will appear a chart listing all the recorded data. The coordinates will depict the graphical data relating to corresponding signals.
Channels selection
In order to select the data to be represented on the coordinates, one should enable “Select signals” option.
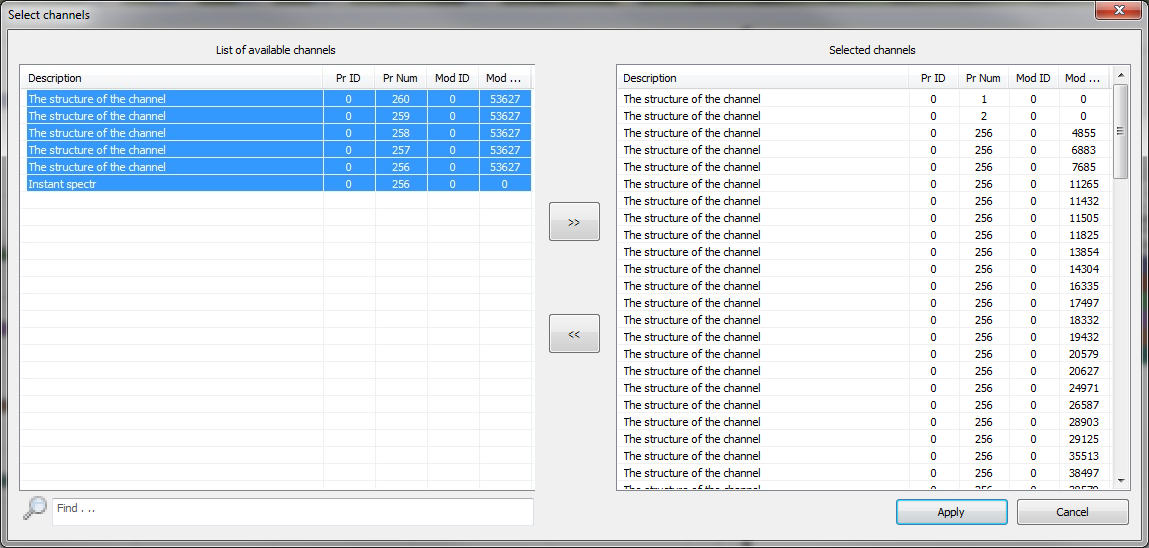
Upon activation of the key you will see “Signals selection” window consisting of:
- charts with available and selected signals;
- channels search field.
The selected channels will be depicted in the “Selection chart of the recorded signal” section of the program.
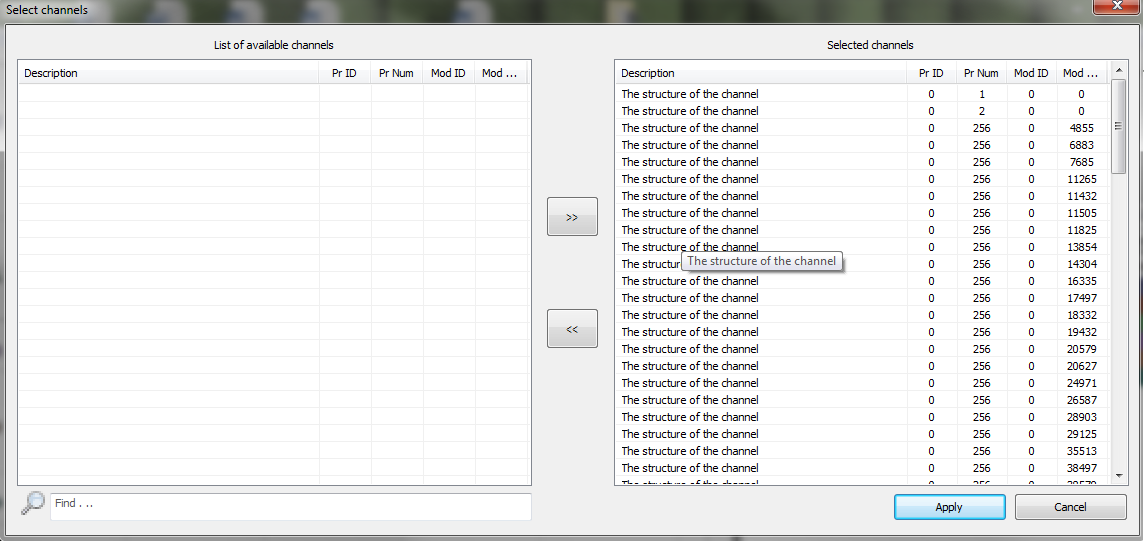
The table “Selected channels” depicts the channels that are selected by the user for further analysis in the coordinate network. The table “Available channels” depicts full range of channels, requested from the data server. For switching between the channels one can use the keys: « ![]() » and «
» and «![]() ». In order to relocate the channel one should highlight it in the list and press corresponding key. To relocate several channels at once one can use “Ctrl” or “Shift” and the corresponding key.
». In order to relocate the channel one should highlight it in the list and press corresponding key. To relocate several channels at once one can use “Ctrl” or “Shift” and the corresponding key.
The search field allows to find and highlight a channel or a group of channels in accordance with the particular request.
Display settings
The “Display settings” key activates the settings tab, in which it is possible to set the parameters of structures representation. It has several active sections:
- Structures type – selection of particular structures to be represented on the coordinate network for further analysis;
- Description by field – selection of value for Y axis (axis X always stands for the date of the recorded structure);
- Highlight a field – selection of the field to be highlighted with color indication.
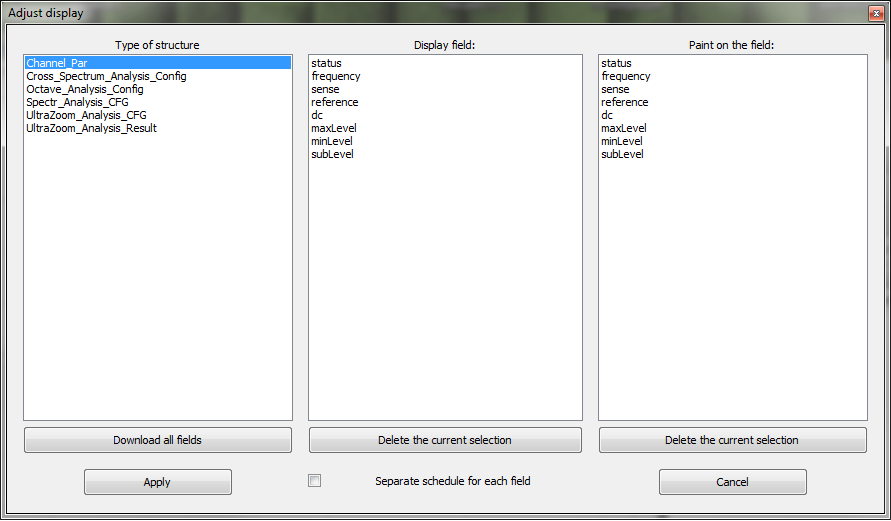
In the case if it is necessary to depict a chart for each of the fields, one should check the “Separate chart for every field” check-box. As the settings changes are saved, the coordinate network and available channels section will depict a more detailed information of the selected data structure.
Data analysis
“Data analysis” key activates a window for selection of the field to be analyzed.
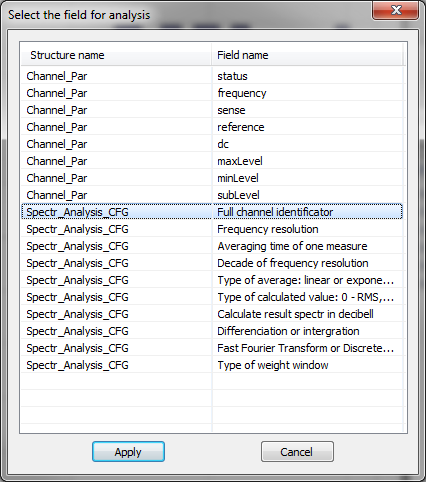
Upon activation of “Apply” key there appears a new window with graphical representation of the selected structure’s analysis results. Depending on the structure’s type there will be different graphical representation (e.g. a spectral pattern for a spectrum).
Recorded structures table
The table is used for selecting the particular structures, signals records of which are to be depicted at the coordinate network. In addition to that, the table may also contain additional information of the selected structures.
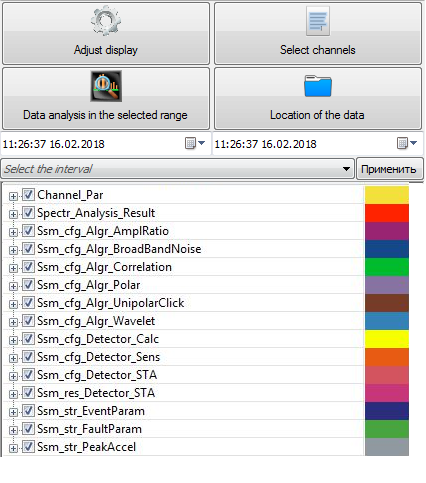
In order to select a particular structure to be depicted at the signals record coordinate network, it is necessary to check the box located to the left from the structure’s name.In order to disable representation of a paticular structure, un-check the corresponding box.
In the case if it is necessary to depict all the structures at once, check the box to the left from “Structure name” section. Un-check the box to disable the function.
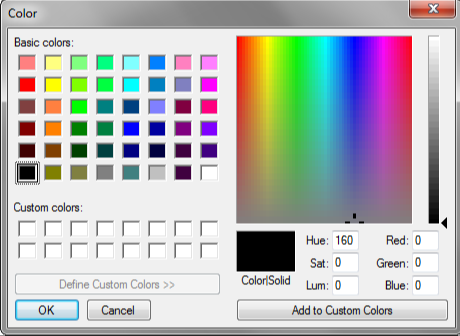
The “Color” tab is used to highlight the recorded signals structures in the coordinate network. Double-click the “Color” key next to corresponding structure. It will activate the “Color” window allowing the user to set the selected color by clicking “OK” key.
Coordinate network
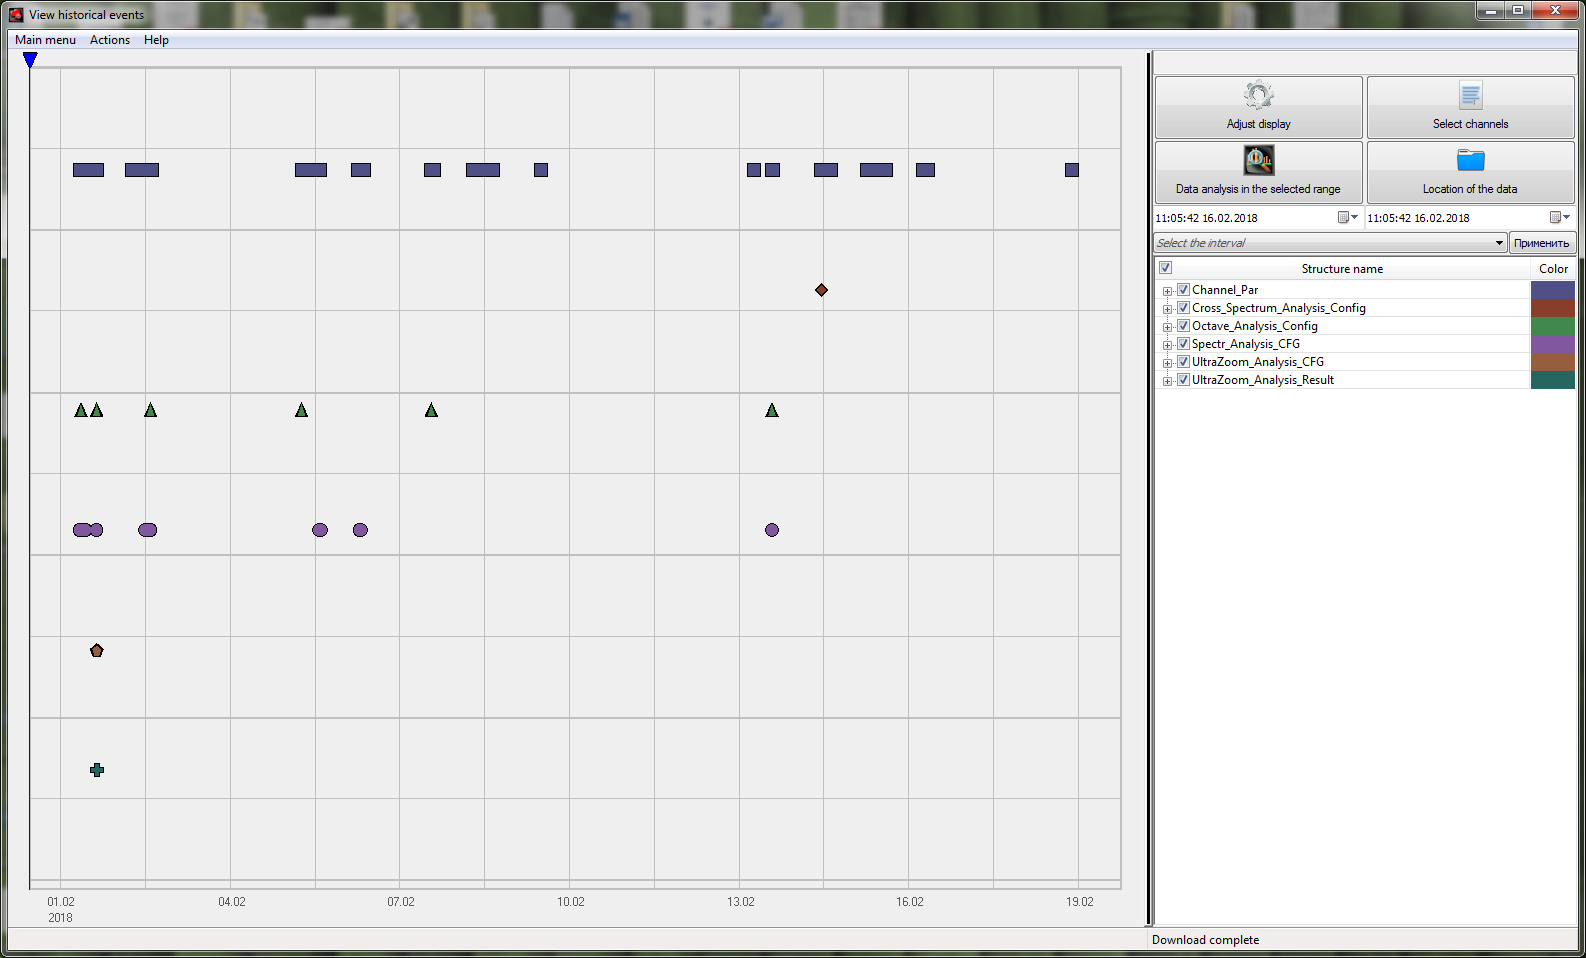
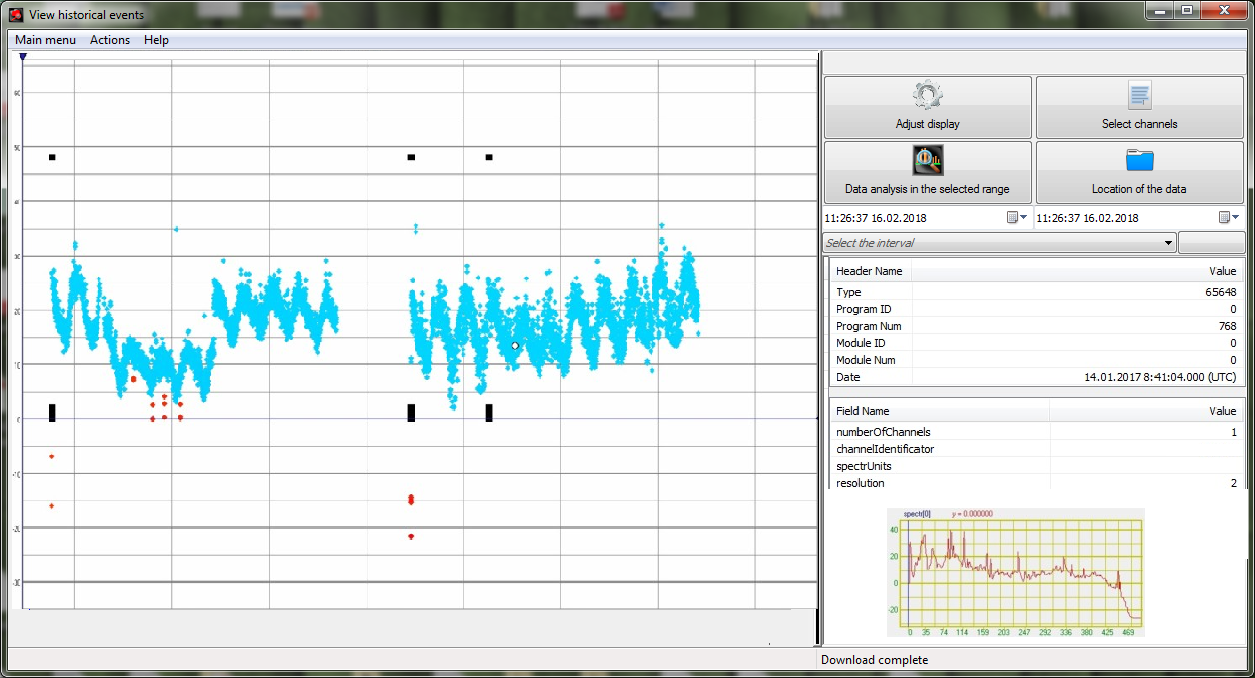
As the active structures have been selected, the coordinate network depicts corresponding data types. Each data type is displayed by a certain figure. The figure color is assigned by the user.
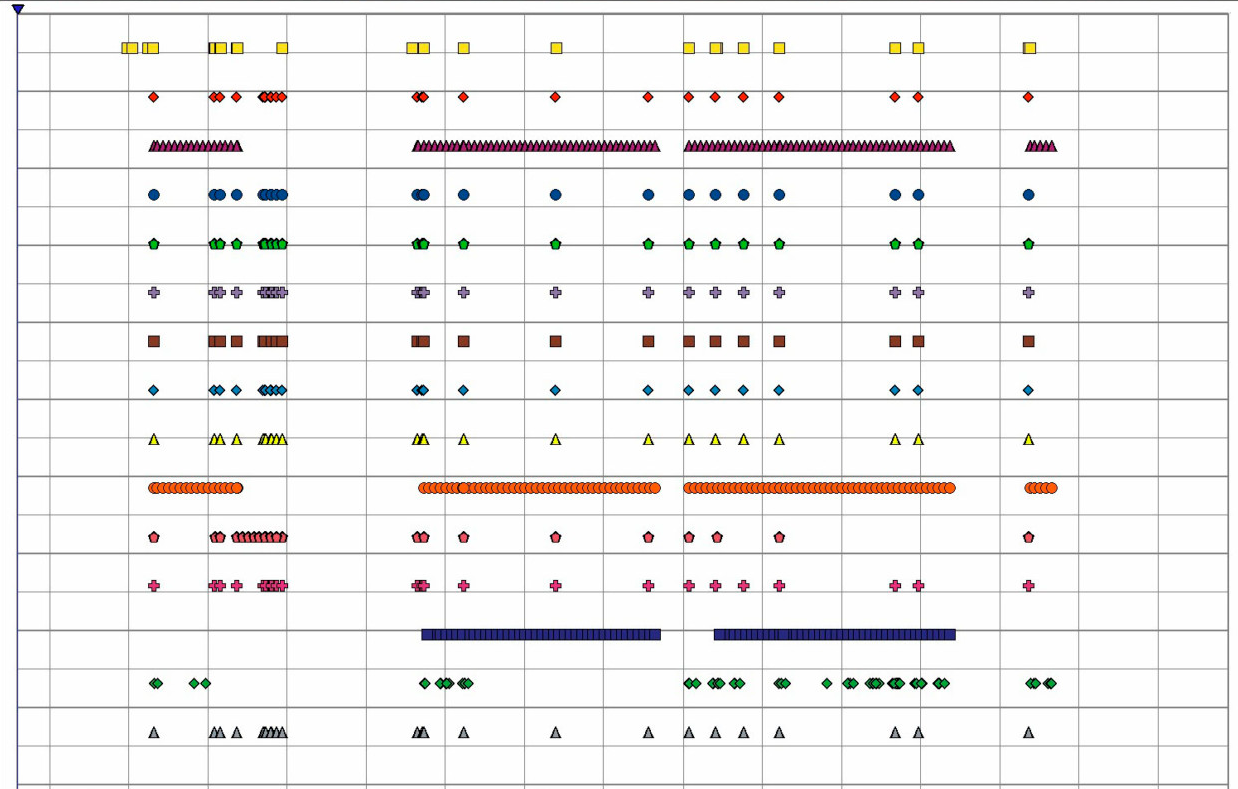
Display area – is an area for active structures signals representation.
Horizontal scale – is a time scale depicting the time period during which active structures signals have been recorded. Vertical scale – is an amplitude scale of the value set in the “Display settings” option. In the mode of displaying all the events the vertical scale does not represent any values.
4 lines in the display area (2 horizontal and 2 vertical) are called markers. Marker can be moved around the display with the left mouse key. The horizontal markers are available only for viewing the selected records with pre-set values of vertical scale.
Amplitude and time information in the area of markers overlapping is displayed in the quick access menu.
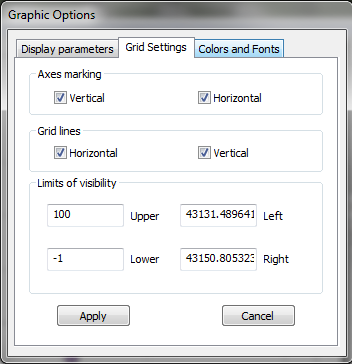
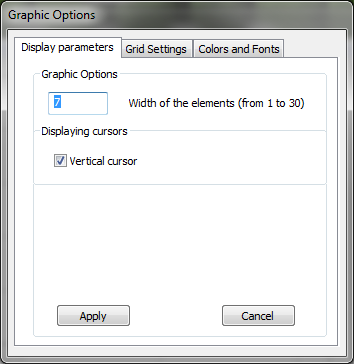
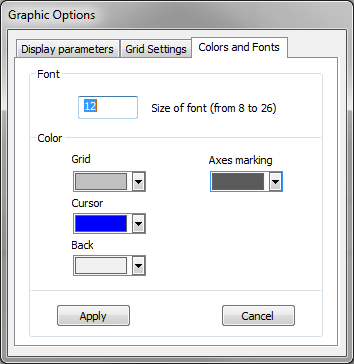
If you want to change the data display in the coordinate network, right-click the display window – this will activate the dialogue window with available settings.
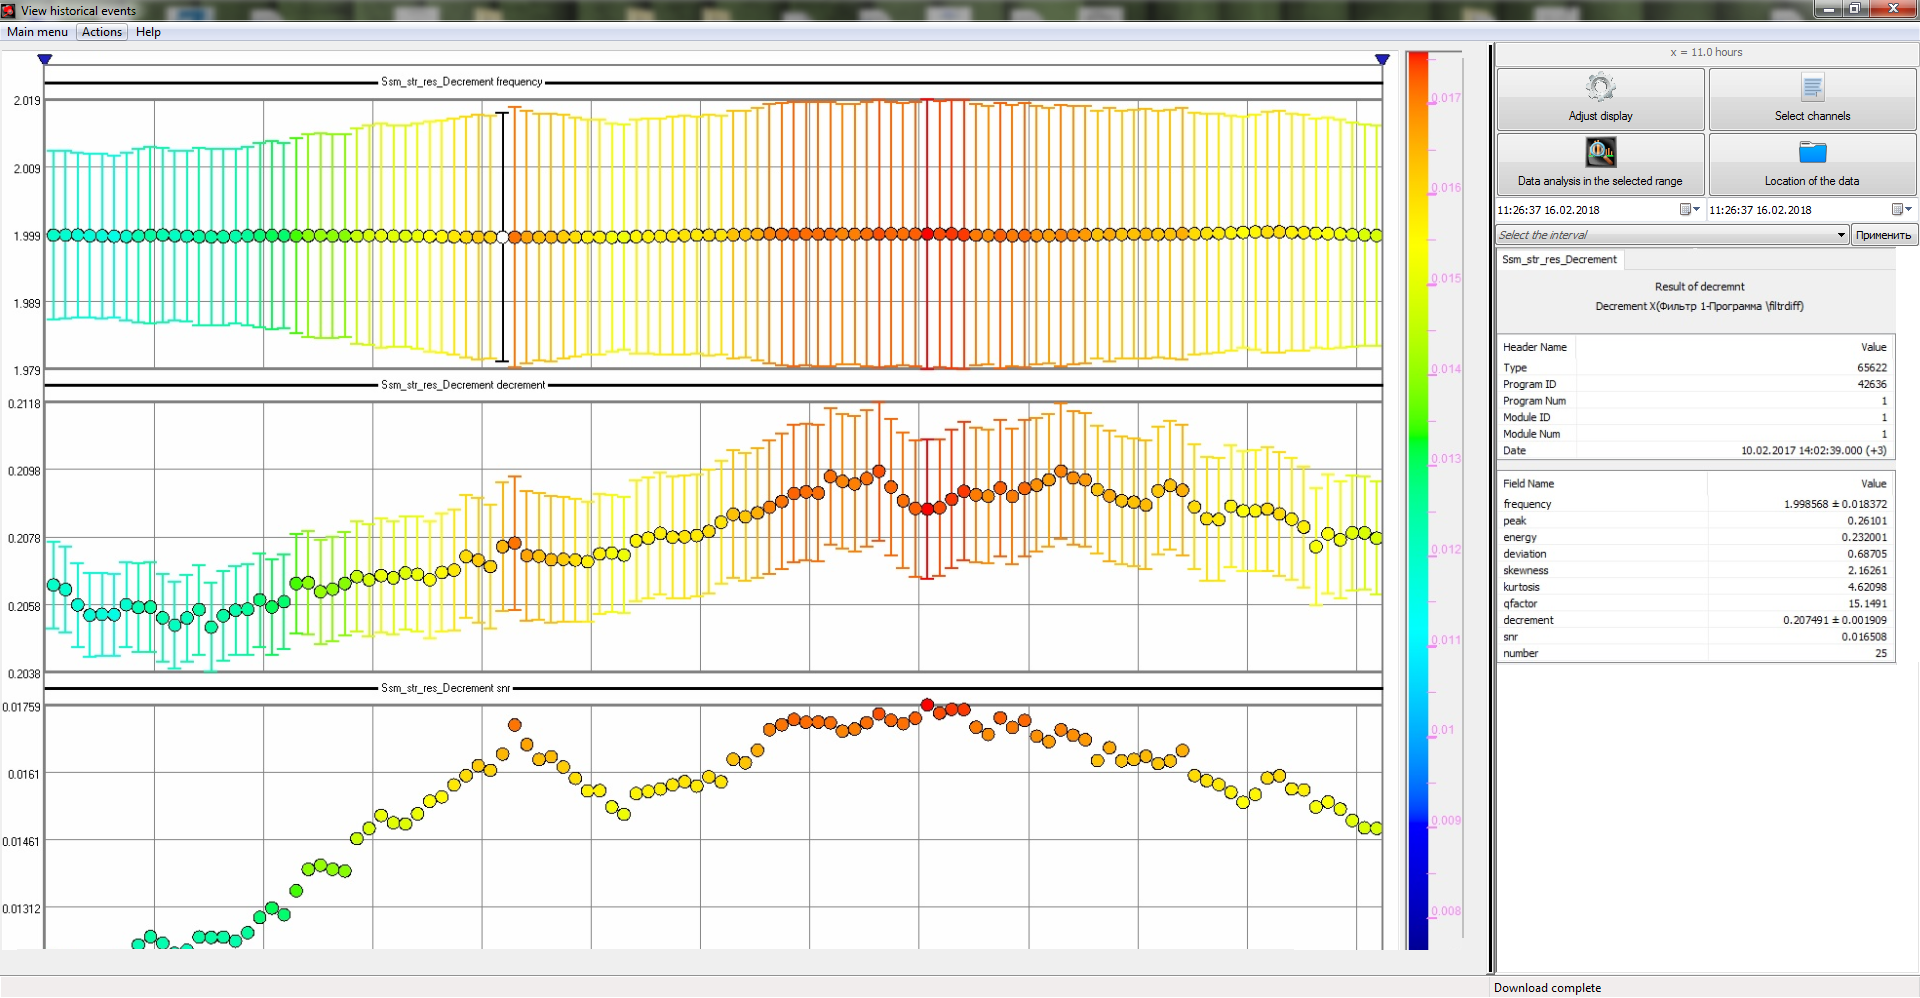
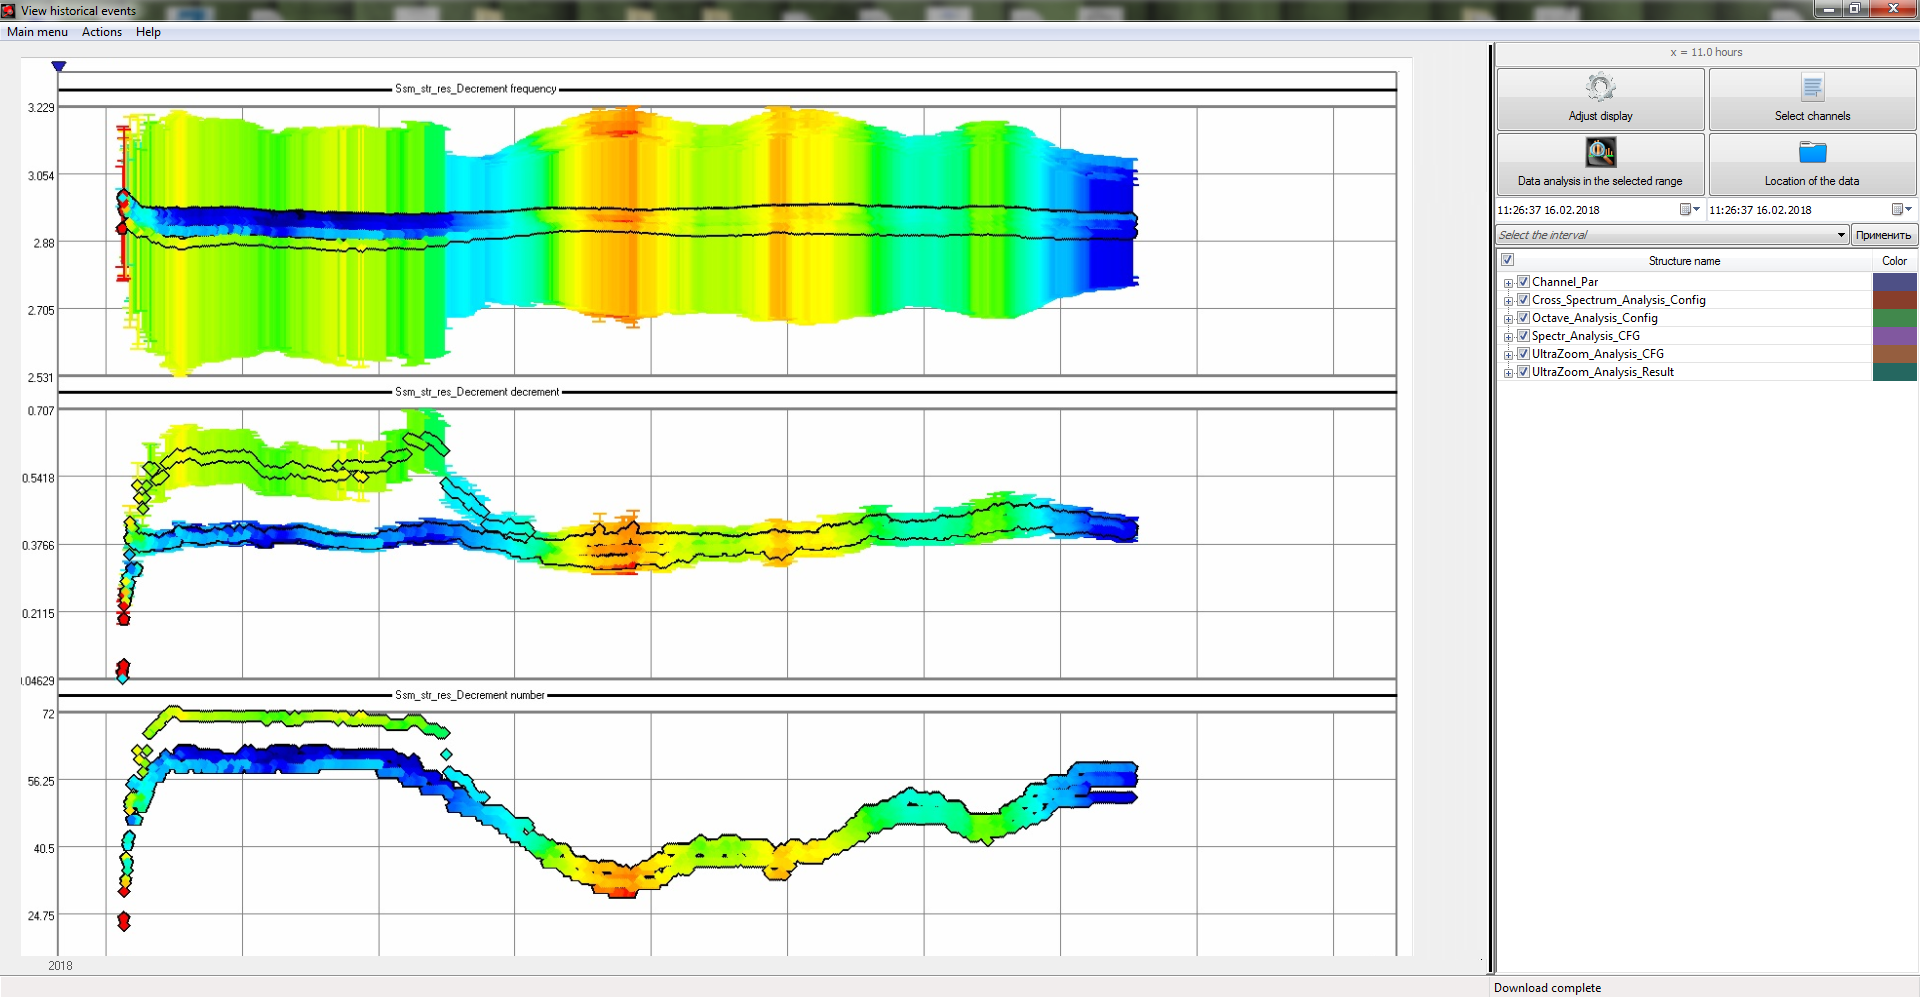
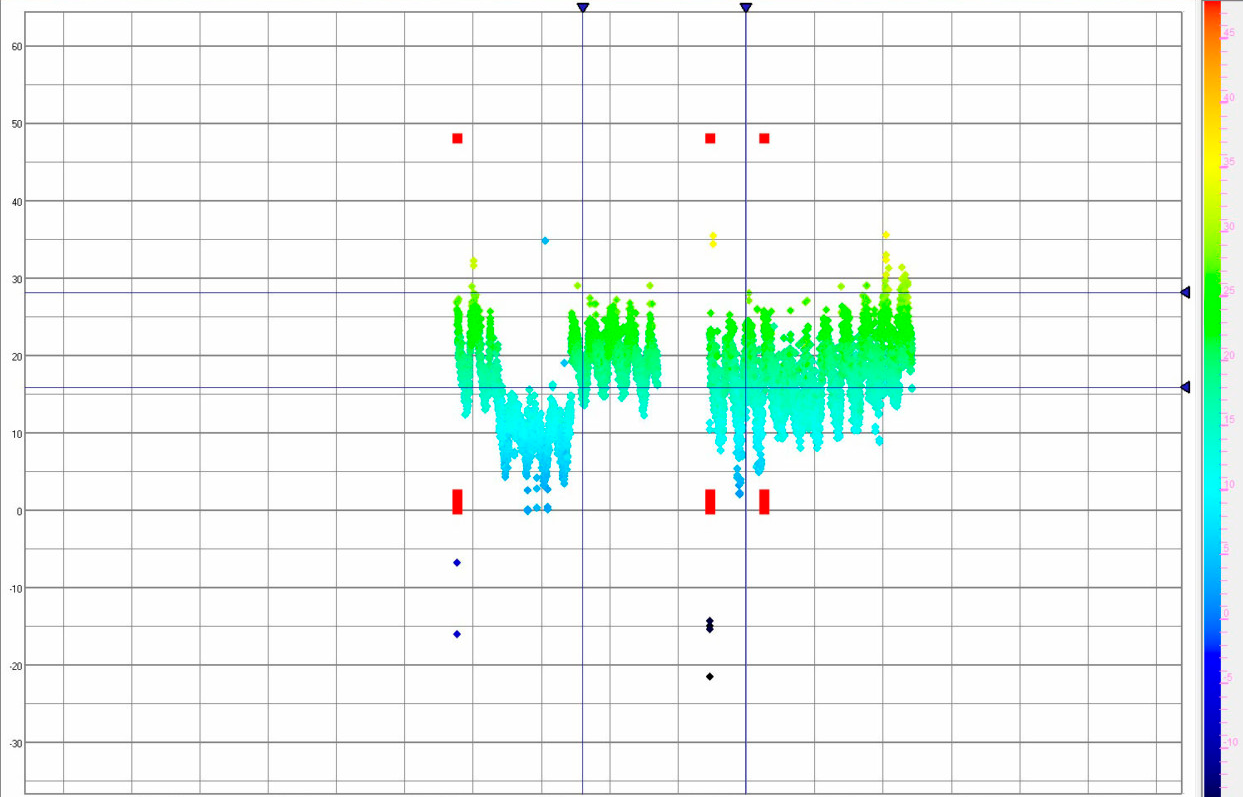
One more special feature of “Historical data viewer” is the possibility of representing the measured values with absolute tolerance in visual format, which, in some cases, is easier to analyse than textual or digital information.
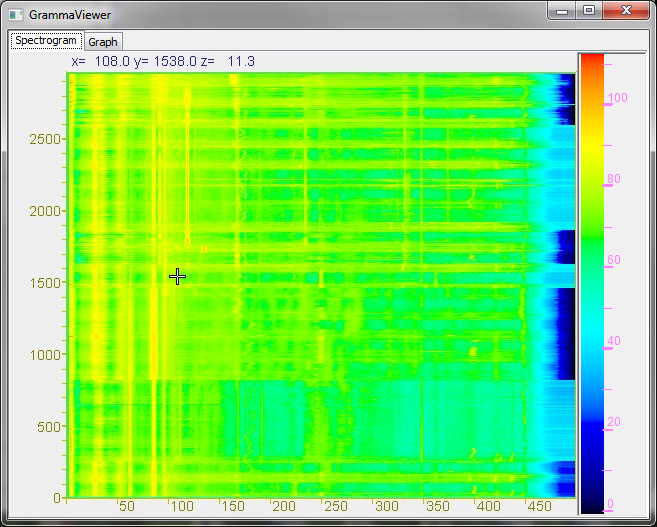
The charts represent the measured value with tolerance limits for a given time span as well as dependence of the measured value on the selected parameter. The dependence is determined by color indication (its measuring scale is placed to the right from the diagram).
For instance, in the course of temperature measurements it is possible to see the value tolerance dynamics as well as humidity impact on temperature meters readings.
This option allows to display a 4-dimensional diagram in a common coordinate network.

