XY Plotter
XY Plotter is used for visualizing (form evaluation) the transfer characteristics of two values to be measured.
The following instruments can be used for transfer characteristics: DC and AC voltmeters, a selective AC voltmeter, a frequency meter, and a phase meter. Characteristics can be displayed in 3 planes (XY, XT, and YT), as well as in a three-dimensional (XYT) view.
Software Features
- selecting a signal display type (XY, XY, YT planes) or three-dimensional view;
- selecting a type of devices providing indications for signal diagram building;
- displaying the form and amplitude of signals coming to the input channels of ADC and DAC modules and spectrum analyzers;
- automatic image scaling;
- signal form display stop at a random moment (the stop-motion mode);
- recording instant values of displayed signals to a file;
- saving an instant screenshot to the clipboard for pasting it to a report or a Microsoft Word or Excel measurement report;
- transferring report values to the clipboard for further pasting to any text or table editor.
Supported Hardware
Input data for XY Plotter includes digital data of the ZETLAB server channel.
XY Plotter is a part of the following software:
- ZETLAB BASE – ADC/DAC board software;
- ZETLAB ANALIZ – spectrum analyzer software;
- ZETLAB VIBRO – vibration bench control system software;
- ZETLAB TENZO – strain-gauge station software;
- ZETLAB SEISMO – seismic station software;
- ZETLAB NOISE – vibration meter-noise meter software;
- ZETLAB SENSOR – digital ZETSENSOR sensor software;
XY Plotter is included in the Display software group.
Software Description
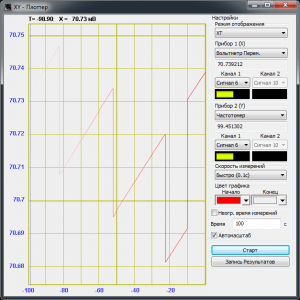
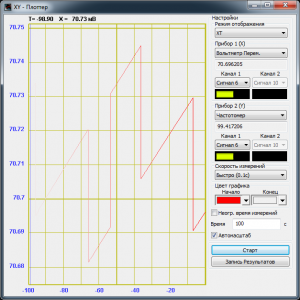
In the Display mode list select a result presentation option. XYT includes display of transfer characteristics of two measured values in a three-dimensional space. ХТ includes display of the measured value characteristic at the time of the first instrument (frame Instrument 1 (Х)). YТ includes display of the measured value characteristic at the time of the second instrument (frame Instrument 2 (Y)). XY includes display of transfer characteristics of two measured values in a two-dimensional plane.
Instruments used for displaying transfer characteristics are selected in the list boxes located under Instrument 1 (Х) for the first instrument and Instrument 2 (Y) for the second instrument, respectively. The following virtual instruments are available: DC and AC voltmeters, a selective AC voltmeter, a frequency meter, and a phase meter.
Measuring channels are selected in the list boxes located under the first instrument list box for the first instrument and under the second instrument list box for the second instrument, respectively.
When the phase meter is selected, there are two list boxes for selecting measuring channels. This is due to the fact that Phase meter determines the phase between two signals.
Under Measurement speed in the list, select diagram update frequency: slowly – once per second; quickly – once per 0.1 second.
Under Colour settings, adjustable diagram color selection parameters are presented. A diagram can be bicolored, if the diagram beginning is set to one color, and the end – to another. Moreover, there will be a smooth color change from the beginning to the end of the diagram.
The flag located left to Unlimited display time is used for continuous data accumulation in diagrams. When the flag is checked, the data is accumulated; when unchecked – not.
The entry box located right to Time (c) is used for entering data display time interval (horizontal scan). When Unlimited display time is checked, the entry box for time intervals is not available.
The flag Auto Scaling is used for automatic scaling (adjustment of the diagram scale to the displayed data). If checked, diagrams will be automatically scaled in relation with the data displayed in them; if unchecked – not.
The Start button starts continuous signal display, and the accumulated data is set to zero.
The Stop (pause) button stops continuous signal display. The process can be restarted with the Start button. The Data recording button is used for recording the data accumulated in a set interval to a *.dtu text file.


