Seismograph
Seismograph program is used for continuous data representation by a large amount of channels (simultaneously and in identical scale – for the purpose of timely detection of the events occurring in the system).
The program is mainly used for seismic survey purposes (it enables seismic data representation from a large number of sensors integrated into various seismic stations of the distributed network, which allows to perform visual estimation of the data received).
The Seismograph program is available in Seismic monitoring panel of ZETLAB SEISMO Software (this Software is delivered together with ZETLAB products for seismic survey).
Note: Seismograph program can be run from ZETLAB directory (location by default: C:ZETLab). Name of the file to be run: ZetSeismoGraph.exe.
Program window has several sections:
- oscillograph chart display section (time realization);
- control panel;
- current information section: list of channels, list of devices, general information.
The section for charts display depicts registered data values – whether in measuring units or in relative values (depending on the set mode) in relation to time parameter.
Control panel

— “Suspend” key allows to suspend visual representation of the recorded data for more detailed analysis

— “Parameters” key activates parameters settings window of the channels representation. Parameters window allows to arrange the channels and to switch-off the channels with irrelevant measuring units as well as to set outer synchronization parameters

— “Autoscale” key is used for the purpose of better visual representation of the charts in relation to the size of the display section
For user’s convenience there are three available oscillograph charts display modes:

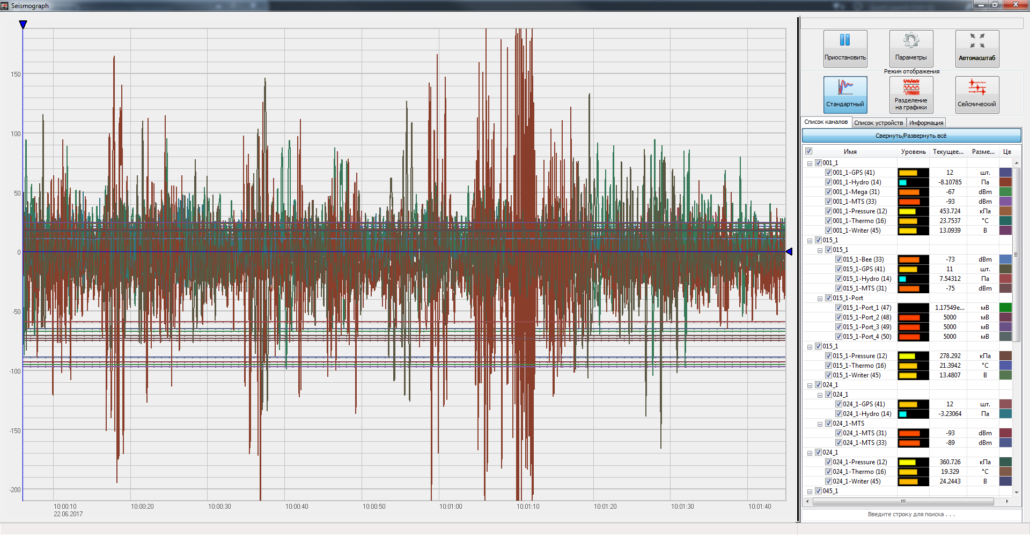
— “Standard” mode – the charts are displayed from several measuring channels in one coordinate syste, (amplitude vs time)

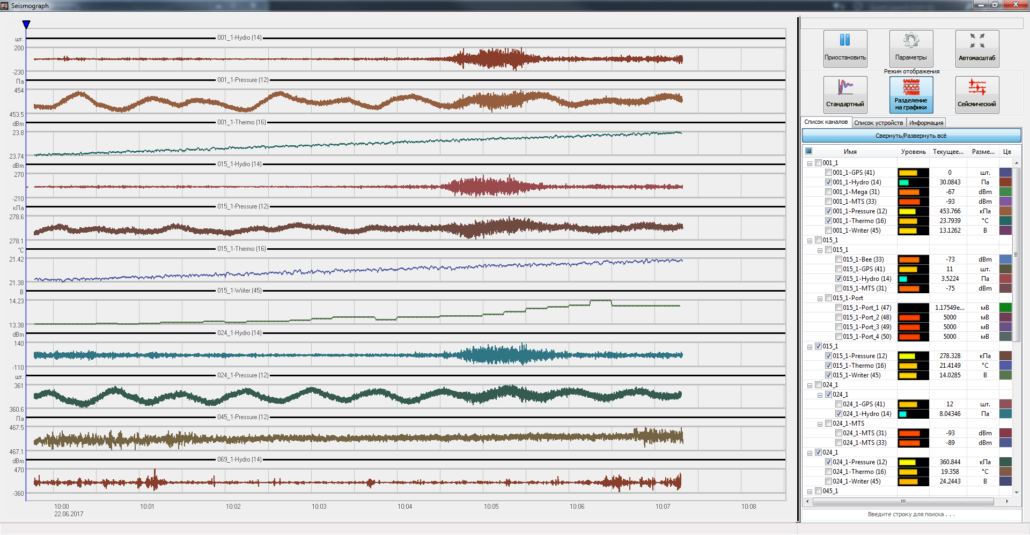
— “Separate charts” mode – there is a separate chart for each particular channel. Advantage of this method is the possibility to control different values using a single oscillograph

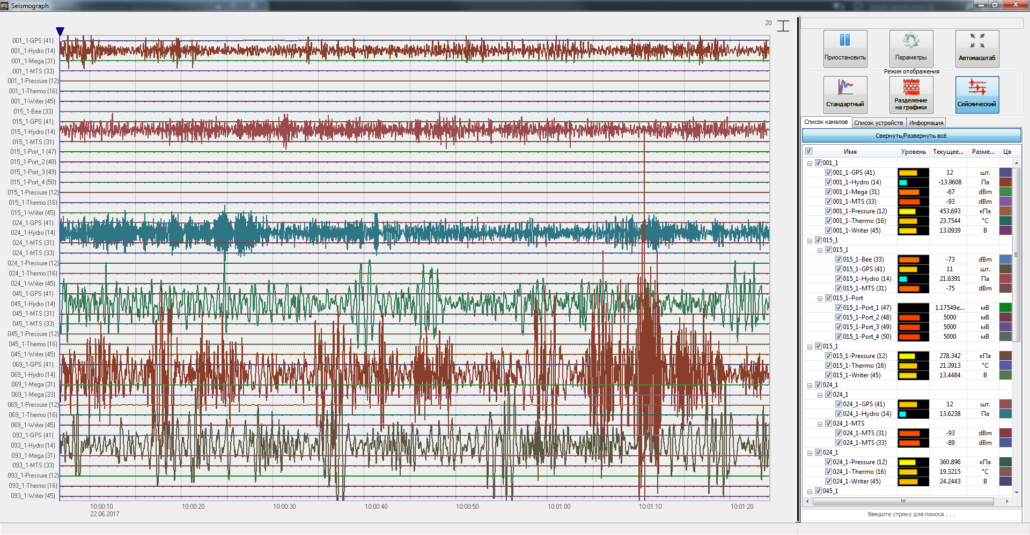
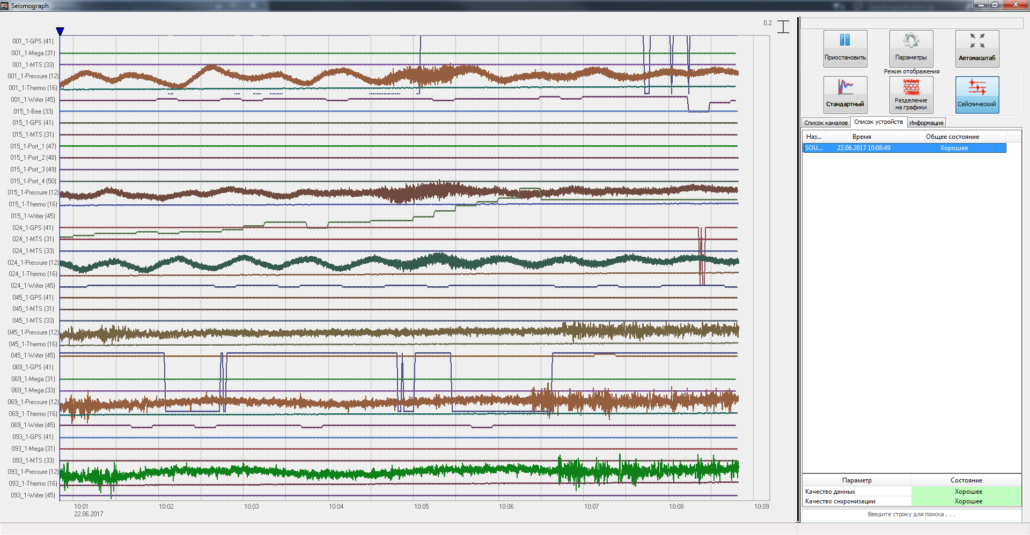
— “Seismic” mode – is used for seismic monitoring and survey purposes for external impacts recording and analysis by means of measuring instruments for a particular time period. The charts are aligned around certain point and are shown in the same axes
The “Seismograph” program is used for near real-time visual representation of the accumulated data as well as for data acquisition in “Seismic mode”, which allows to estimate the selected recorded parameters as well as to control operation of the connected devices.


