
Signals gallery
Program “Signal gallery” is used for viewing and analysis of the recorded signal (whether from HD or in remote way).
Special features and advantages of «Signal gallery» program:
- Signal files from various HD directories or PC-s are united into a single data base, which considerably simplifies and accelerates work with the files;
- Files search in automated mode;
- User-friendly interface;
- Pre-view of signals. The files are represented as minor copy of signal chart;
- Possibility of comparing several signals in one coordinate frame.
- Signal trends view for a paticular measurements period.
User interface
To start the program Signal gallery, select “Signal gallery” in the Display menu of ZETLab panel. The program window will appear at the display (Figure 3.1).
The top section of the window shows the name of the program and the channel, by which analysis is performed.
Note: program Signal gallery can be started from ZETLab directory (by default: c:\ZetLab\). Name of the file to be run: ZETSignalGallery.exe
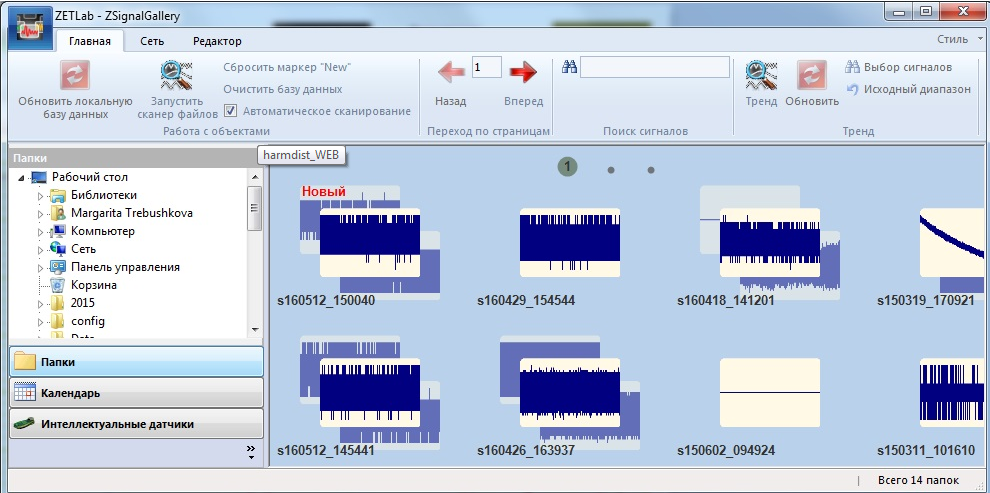
Figure 3.1

Main program window
The program consists of the main window with all application tools available:
- Program area. Display of files and folders
- Side panel. Menu «File explorer» and «Calendar»
- Instrument panel.

Initiation of scanning process
To start, click «Initiate scanning files» key, it will activate search window containing:
- A section with a key, that starts scanning PC directories for files, and a status bar depicting the progress of search progress.
- A table listing the directories found.
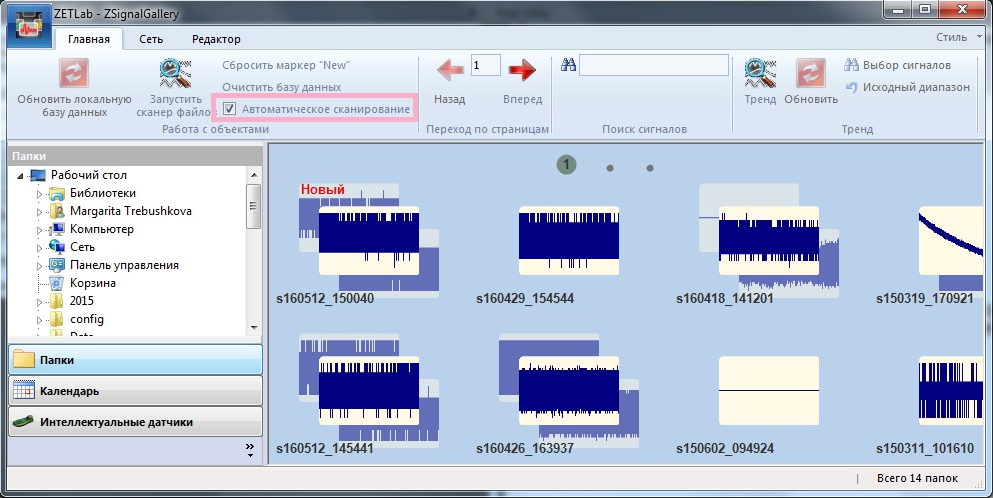
Automated signals scanning

As the search process is complete, the detected directories will be transferred to the main program window with a “New” label (to remove the label, click “Reset the ‘New’ marker”). The main section of the program will depict pre-views of signal folders. The search data will be saved (thus, as the program is run next time, new directories will be downloaded automatically).
In the case if “Automated scanning” option is enabled, the program will scan the selected directories. Thus, if new signals were recorded to the selected folder, the signals data will be shown at the main program section.
View files
By clicking at one of the previews, the user opens the files list of the selected directory. It is represented by a list of preview images of recorded signals and corresponding description, which includes such parameters as “Maximum”, “Minimum”, “Average”, “Root-mean-square deviation”, “Offset DC”, recording duration, “Record date”, “Record start time”, “Duration”, “Sampling frequency”.

View file parameters
By clicking at the signal description it is possible to view corresponding charts.
The amount of the channels that can be selected is not limited – they will appear sequentially. Graphical representation system allows to zoom-in/-out, move the displayed area and determine precise instant values of the signal. In order to close a signal chart, click its preview picture again.

Signals view

Network
In order to obtain the data from remote PC, enter its IP address in the field “IP address of the node”. If the connection is performed by means of a Proxy-server, check the box “Enable relaying” and enter IP address to corresponding field. Then click the key “Request network data”.
In order to display the signals in the program upon record process completion, click the key “Update the local database” (in the case if local PC is used). In the case of remote data processing, establish connection to the PC and select option “Delete the preview database”.

Signal editor
“Edit”menu allows to view the recorded signal. “Selection” option allows to perform group operations with the signals. “Cut” is used to divide the signal into several components. “Glue” option is used to unite the signals. “Delete” allows to remove the signals. “Playback signals” option allows to view the signals. “Explorer” program allows to find the necessary signals. The signals are available for saving and conversion into various formats: binary (*.ana/*.anp), text *.dtu, Seg-Y, Wave (*.wav). Such options as print and preview are also available. The charts by X axis are available for viewing in various measuring units (reports, seconds, date/time). “Autoscale” option is also available. There is an option of downloading the entire folder when a file is opened.

Graph trends
To view the graph trends, click the key “Trends” – after that you will see trend graph for the selected period of measurements as well as signal channels chart.
In the course of first view of the trend some time will be spent for downloading and cashing of the data related to the trend (it is recommended to wait till this process is complete – the process status will be displayed in corresponding menu).
Using the mouse it is also possible to increase the scale of a graph and to view the trend in more details. In the channels table it is possible to enable and disable representation of particular signal channels at the diagram.

Channels selection
List of available signals – list of all signals in the database.
Selected signals – signals currently selected for viewing.
It is also possible to set the time interval for representation.
Search mask allows to perform search of signals by name and measuring units. It is possible to use the following symbols in the mask:
? – any single symbol
* – arbitrary amount of symbols
; – separator between different masks