
Method of Determining the XY-Coordinates
Of A Low Noise Object Based On Algorithm of Reverse Projections of Mutual Correlation Functions of Seismic Signals
In places where vibrations (noise) occur, seismic waves spreading in all directions are formed (figure 1). The spreading wave affects seismic sensors when reaching them. It is experimentally found that waves of transverse fluctuations make maximum energy contribution to the signal (Fig. 3), therefore the sensors used have only one sensitivity component and are installed vertically on the ground (or horizontally on the wall). Then, the signal from sensors is digitized through ADC and sent to the location of algorithm input in digital form. Time difference of wave arrival to each specified sensor pair is recorded using correlational analysis. Not only correlational analysis, but also other methods of events detection are used (for example, the STA/LTA seismic detector)
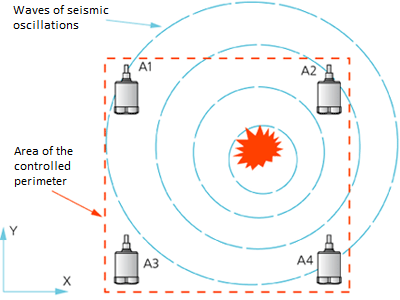 Figure 1. Experiment diagram |
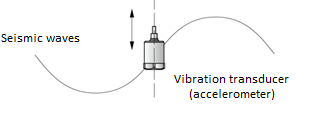 Figure 2. Spreading of transversal waves |
The basis of the used algorithm for passive location of vibration (noise) sources is determination of time delay difference of wave arrival to different registration posts located (preferably) around the perimeter of a protected facility, using the method of mutual correlational analysis.
 Figure 3. Functional flowchart of localization algorithm |
 Figure 4. Result of algorithm functioning |
Furthermore, counts of the correlation function with a respective time delay are compared with each point of defined XY-plane using the reverse projections – a two-dimensional array is formed. Each element of the array corresponds to a certain range of protected perimeter and contains “energy contribution” of this area to overall noise level. The similar calculation of a two-dimensional array occurs for each correlational pair and sums up with previous arrays. The algorithm result is a graphical representation (XY-gram), in which space corresponding to a coordinate of noise source effect on soil of protected perimeter is gradually shown. A result of the algorithm is presented in Figure 4. The functional layout of the experiment is shown on Figure 3.
Note that the researched signals collected from recording cells, i.e. vibration sensors (accelerometers), can be masked by noises, for example, signal almost always contains 50 Hz interference. When the protected territory is close to highway or railway, technology-related interference can impact the signal. Thus, before building the mutual correlation functions and further manipulations with them, it’s necessary to perform a number of steps for improving quality of the researched signal. The original signal will be improved in several stages.
First iteration includes lower and upper frequency filtering. It is experimentally proven that waves within 10 Hz frequency range and lower than ÷ 100 Hz make maximum energy contribution to the signal, upper frequency restriction relates to rapid attenuation of the soil fluctuation wave (i.e. wave absorption). The low frequency restriction is associated with wavelengths and distance at which we are carrying out measurements. Let us assume that protected perimeter is 500×500 m (maximum perimeter size is 4×4 km), rate of soil wave spreading (sand-soil mixture) is approximately v = 1000 m/s (in reality, wave rate can change depending on soil quality), wavelength λ = v/υ, therefore the wave at frequency υ = 0.1 Hz will be 10 km long, so it is superfluous for the 500 meter zone. Naturally, this kind of waves will make negative contribution to the researched signal. At the same time, the wave at frequency υ = 10 Hz corresponds to 100 m, which is quite acceptable.
Second iteration includes filtration of 50 Hz interference, as shown on Figure 5.
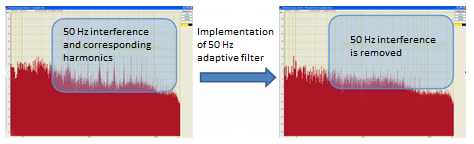
Figure 5. Result of 50 Hz interference filtering
Third iteration. Study of other interferences and, if necessary, use of a band stop filter. After taking action, it is possible to visually evaluate the quality of preliminary digital processing of signal. Oscillograms of original and cleared signals are shown on Figure 6.
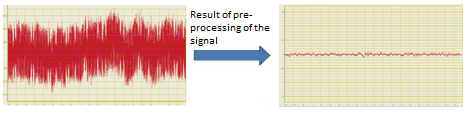
Figure 6. Signal after preliminary processing. Left — before processing, right — after processing. Oscillograms are shown in the same scale
Signal dispersion before processing is 1 mV, after processing – 0.2 mV, a five-time difference (or 20 lg5 = 14 dB). After preliminary digital processing of signal, you can perform direct correlational signal analysis. For this task, it is essential to choose a proper calculation time and averaging time of the correlation function. If these parameters are chosen correctly, the following will be the case (Figure 7).

Figure 7. Graph of cross correlation function
The blue line on the figure shows the ∆t difference corresponding to difference of wave arrival time from vibration source, which makes maximum contribution to general background of noises. Most likely, this effect is caused by impact of the searched sound-producing object.
In reality, ∆t of maximum correlational peak does not correspond to time delay of seismic wave arrival to sensors directly from the searched object. That is why the traditional methods of object bearing determination which are based on this principle, will not work when tracking the low noise “targets”. It this case, the most important thing is data averaging for each correlation function and data accumulation on several implementations of correlation functions calculated along different directions (for example, in the task described on Figure 1 there are six possible options of correlation function building). Then, the correlation functions of already cleared input signals arrive to input of the reverse projections algorithm, then graphical representation of calculated data occurs (Figure 4). Thanks to absence of binding to a certain correlational peak, this method has advantage of tracking several targets at once, which is very important for solving real location problems.
The main advantages of this system are the following characteristics:
- high sensitivity,
- rapid location,
- accurate determination of coordinates,
- several objects tracking,
- high reliability,
- high level of process automation,
- real time detection.
The above method of surface impact monitoring used for supervising over the protected territory can be considered in terms of study of geophysical processes, such as location of a bottom during the deep boring of wells (subject to addition of one more component – Z).