Diagnostics of gear units
Based on spectrum of envelope curve
In case of occurrence and development of a defect on a rotating element, an amplitude modulation equal to a rotational frequency should be observed in the noise bands connected with the signals induced by such defect. The degree of modulation depends on the level of defect development. The program — envelope curve is used for search and analysis of such faults. This program is implemented as follows.
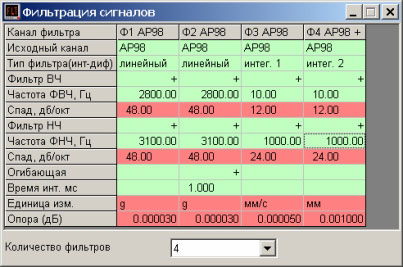
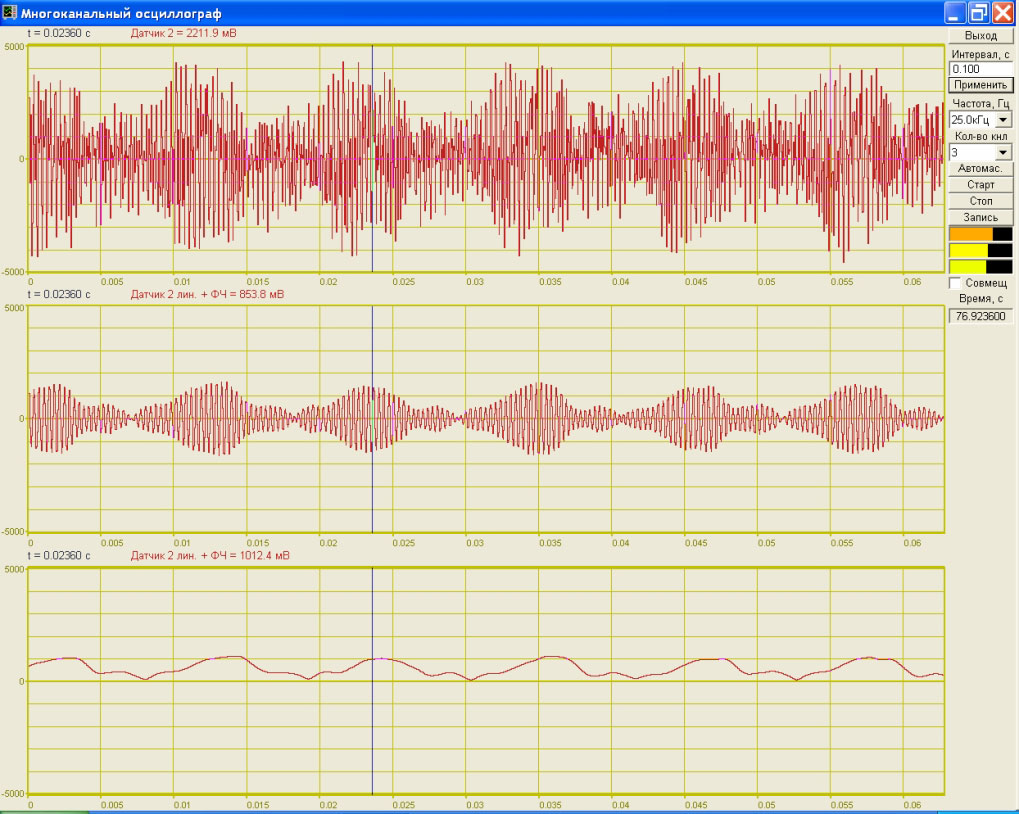
A user configures a digital filter (appearance of the signal filtering program is shown in Figure 1) — a central filter frequency and filter bandwidth. Then the filter with the preset parameters processes an input stream of digitized data. After the filter circuit a sensor and integrator operates. The output signal after processing can be checked in the form of graph. Figure 2 shows the graphs of signals: original signal, signal after the filter and envelope curve of the vibration pickup’s signal. The bandwidth is equal to 200 Hz, the central filter frequency is 3 kHz — the first gear-meshing frequency.
Fourier transformation is used to extract a periodic component from the amplitude signal envelope, which results in the spectrum of amplitude envelope. Figure 3 shows the graph of amplitude envelope spectrum. The graph contains a peak at the frequency of about 90 Hz equal to the shaft speed. The high level of this peak shows a great degree of modulation of vibration pickup’s signal at the gear-meshing frequency and therefore it suggests the degree of axial asymmetry of gear pair.
The level of amplitude envelope modulation and, hence, the level of envelope spectrum allows judging the degree of defect development and using this method for troubleshooting and output products inspection.
See also:
- diagnostics of gear units;
- diagnostics of gear units based on spectrum of vibration signal;
- diagnostics of gear units based on super narrow-band spectrum;
- diagnostics of gear units based on co-spectrum characteristics;
- diagnostics of gear units based on inter-correlation characteristics;
- diagnostics of gear units based on order normalization.


